Merge penn fix conflicts #54
Conversation
|
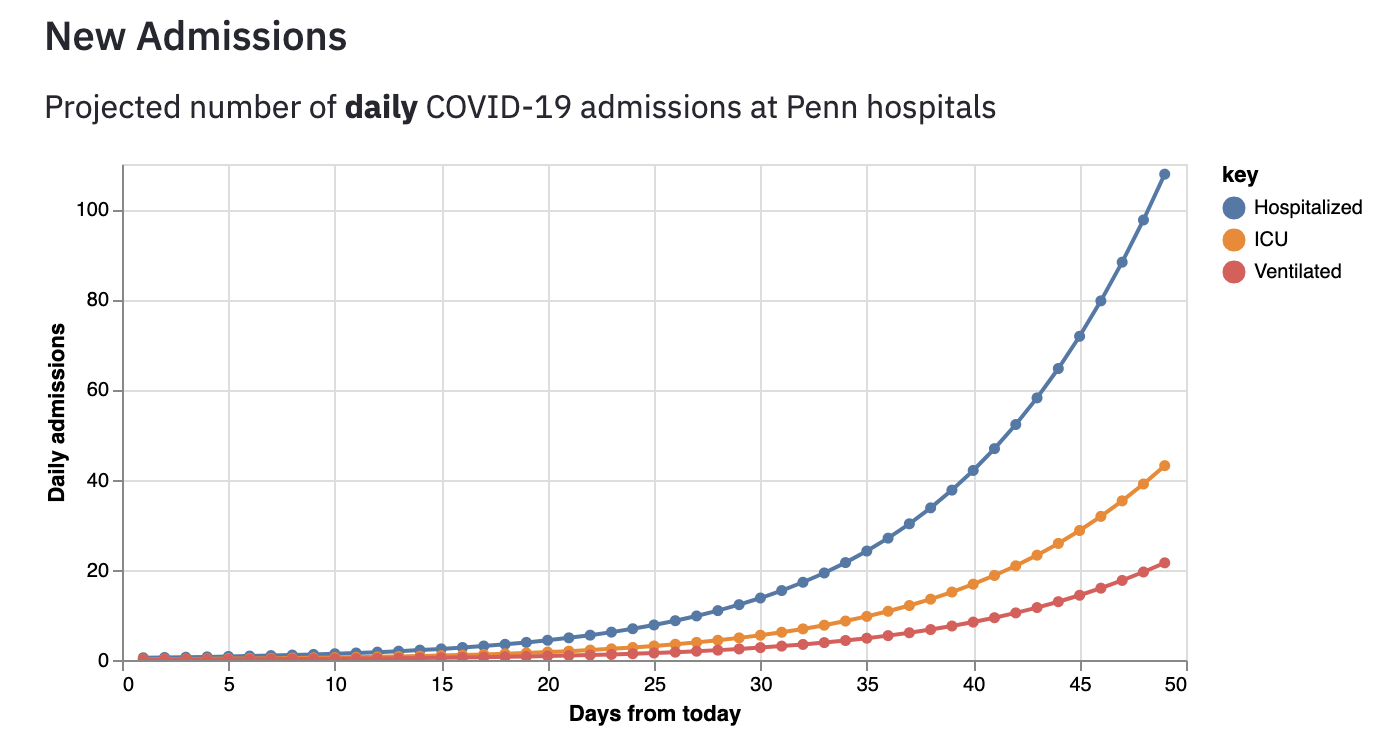
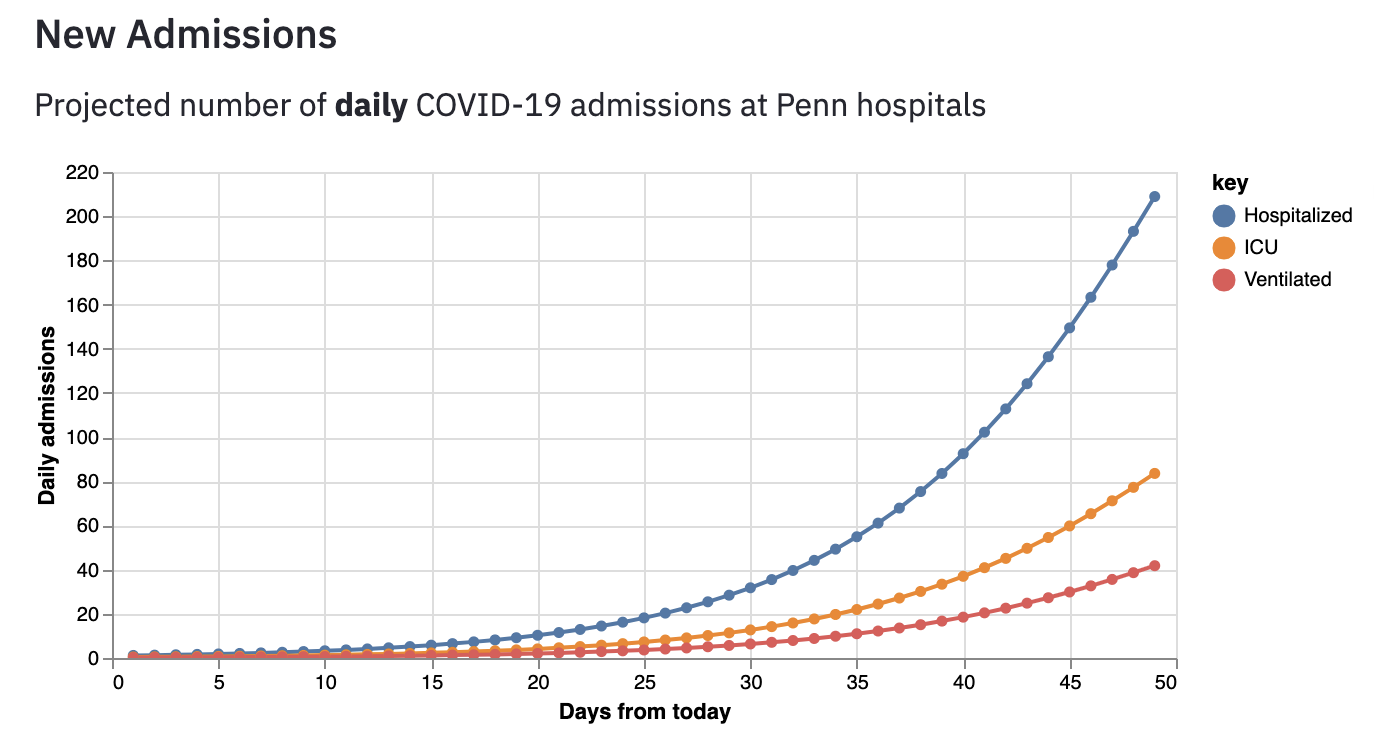
hey @sam-qordoba I'm seeing several regressions against the current prod app. I'll start a list of them here: Prod: Prod: I'll add more as I find them |
|
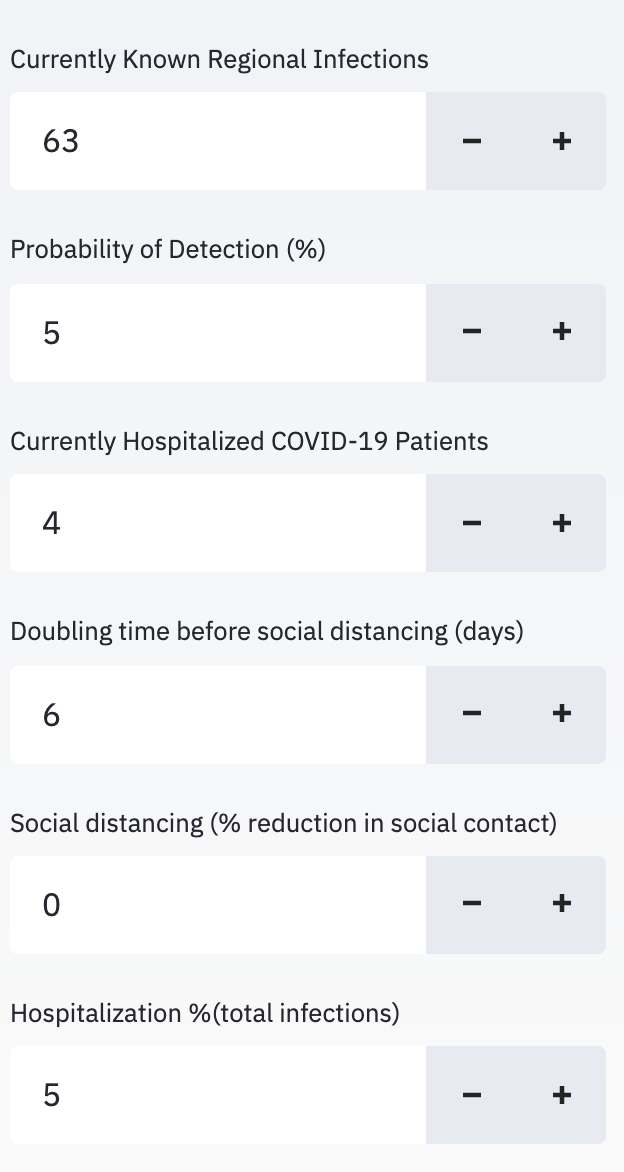
A key difference between this and current prod is the user input of prob of detection, rather than inferring it directly from number of hospitalizations, hospitalization %, and market share. |
|
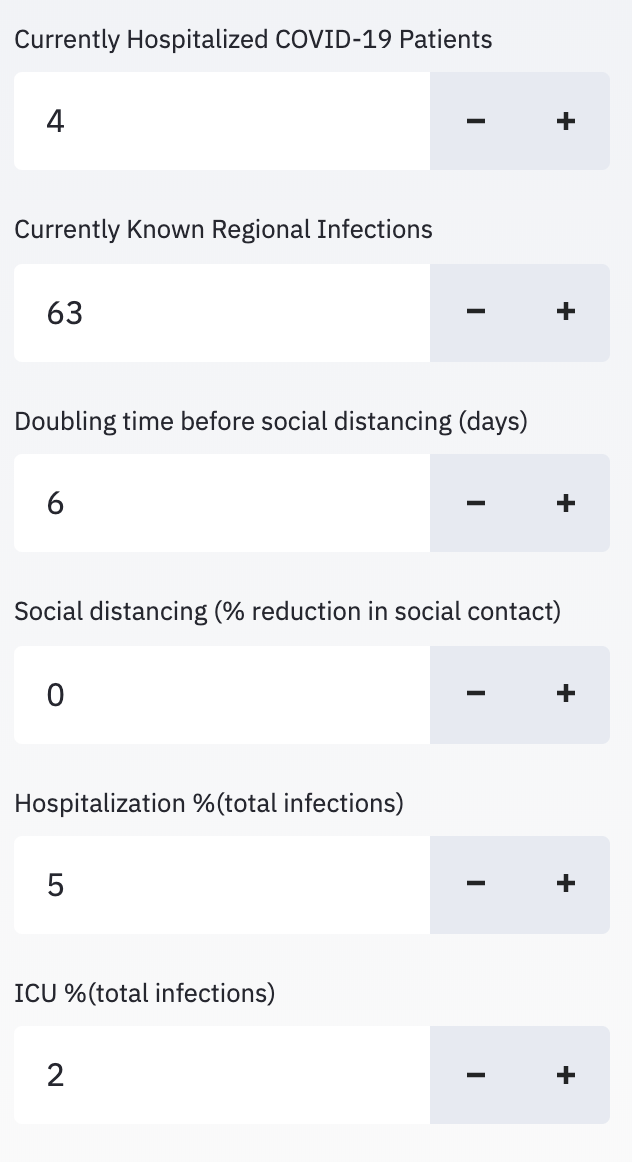
I think the discrepency w the data/results are because of i'm currently fixing the input order in the sidebar. @cjbayesian probability of detection isn't in prod, so where should i put that on the sidebar (between what 2 parameters)? or should i bake in a default and remove it from UI? if there's an earlier version where that parameter was inferred, could you point me to that strip of code so i can restore it? |
|
@quinn-dougherty Thanks. It's https://github.com/pennsignals/chime/blob/f4eb1a5e3e25af105dc76e32e099eedad887f307/app.py#L62 and https://github.com/pennsignals/chime/blob/f4eb1a5e3e25af105dc76e32e099eedad887f307/app.py#L63 There the |
|
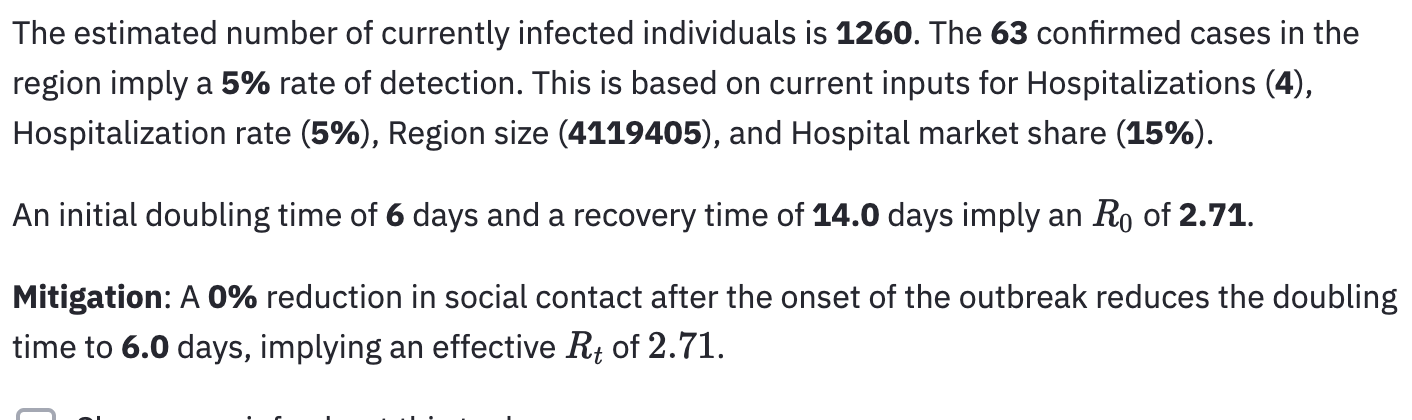
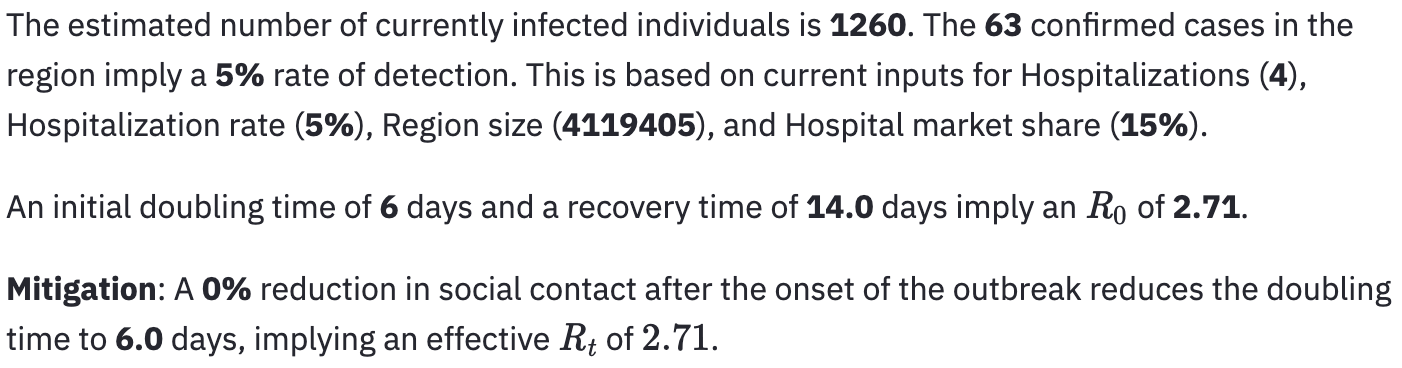
So we should remove the probability of detection input from the sidebar. All of the description text is in line with the method of calculating the total number of currently affected individuals that is in current prod. We can consider changing the way this is being estimated in a future version, but would need to ensure that all description text, documentation, explanations are consistent with the approach. |
…ation of detection_prob
|
Side-by-side now looks good to me. @mdbecker to confirm. |
|
Checking now. Thanks! |
This is just #49 but with 2 commits of mine fixing the merge conflict.
Some notes I am copying from that PR:
This should be merged before #50 or #51 or I worry they will get overwritten.
A lot of these changes are things like adding definitions, and using
Length of Stayinstead ofLOS, as requested by a non-native English speaker working on translating this. However, there is also the change to the denominator ofbeta, which now includes* (1-relative_contact_rate), which propagates through numbers that feed the charts. So this also affects the analysis.