
SyncPad is a real-time, collaborative drawing application built with Next.js, Express, TypeScript, Tailwind CSS, and Turborepo. It allows multiple users to draw simultaneously on a shared canvas – no third-party APIs used. The canvas sync logic is handcrafted for optimal control and performance.
SyncPad is built with a DevSecOps-first mindset, ensuring secure, automated builds and deployments with visibility and control at every step.
- A Next.js frontend (
apps/web)- An Express backend (
apps/http-backend)- A WebSocket server (
apps/ws-backend)- A shared database layer using Prisma (
packages/db)
dev: Application development (code, logic, features)prod: Production-ready version with DevOps pipelines integrated
Watch here: https://youtu.be/wNKNHBRvYC8
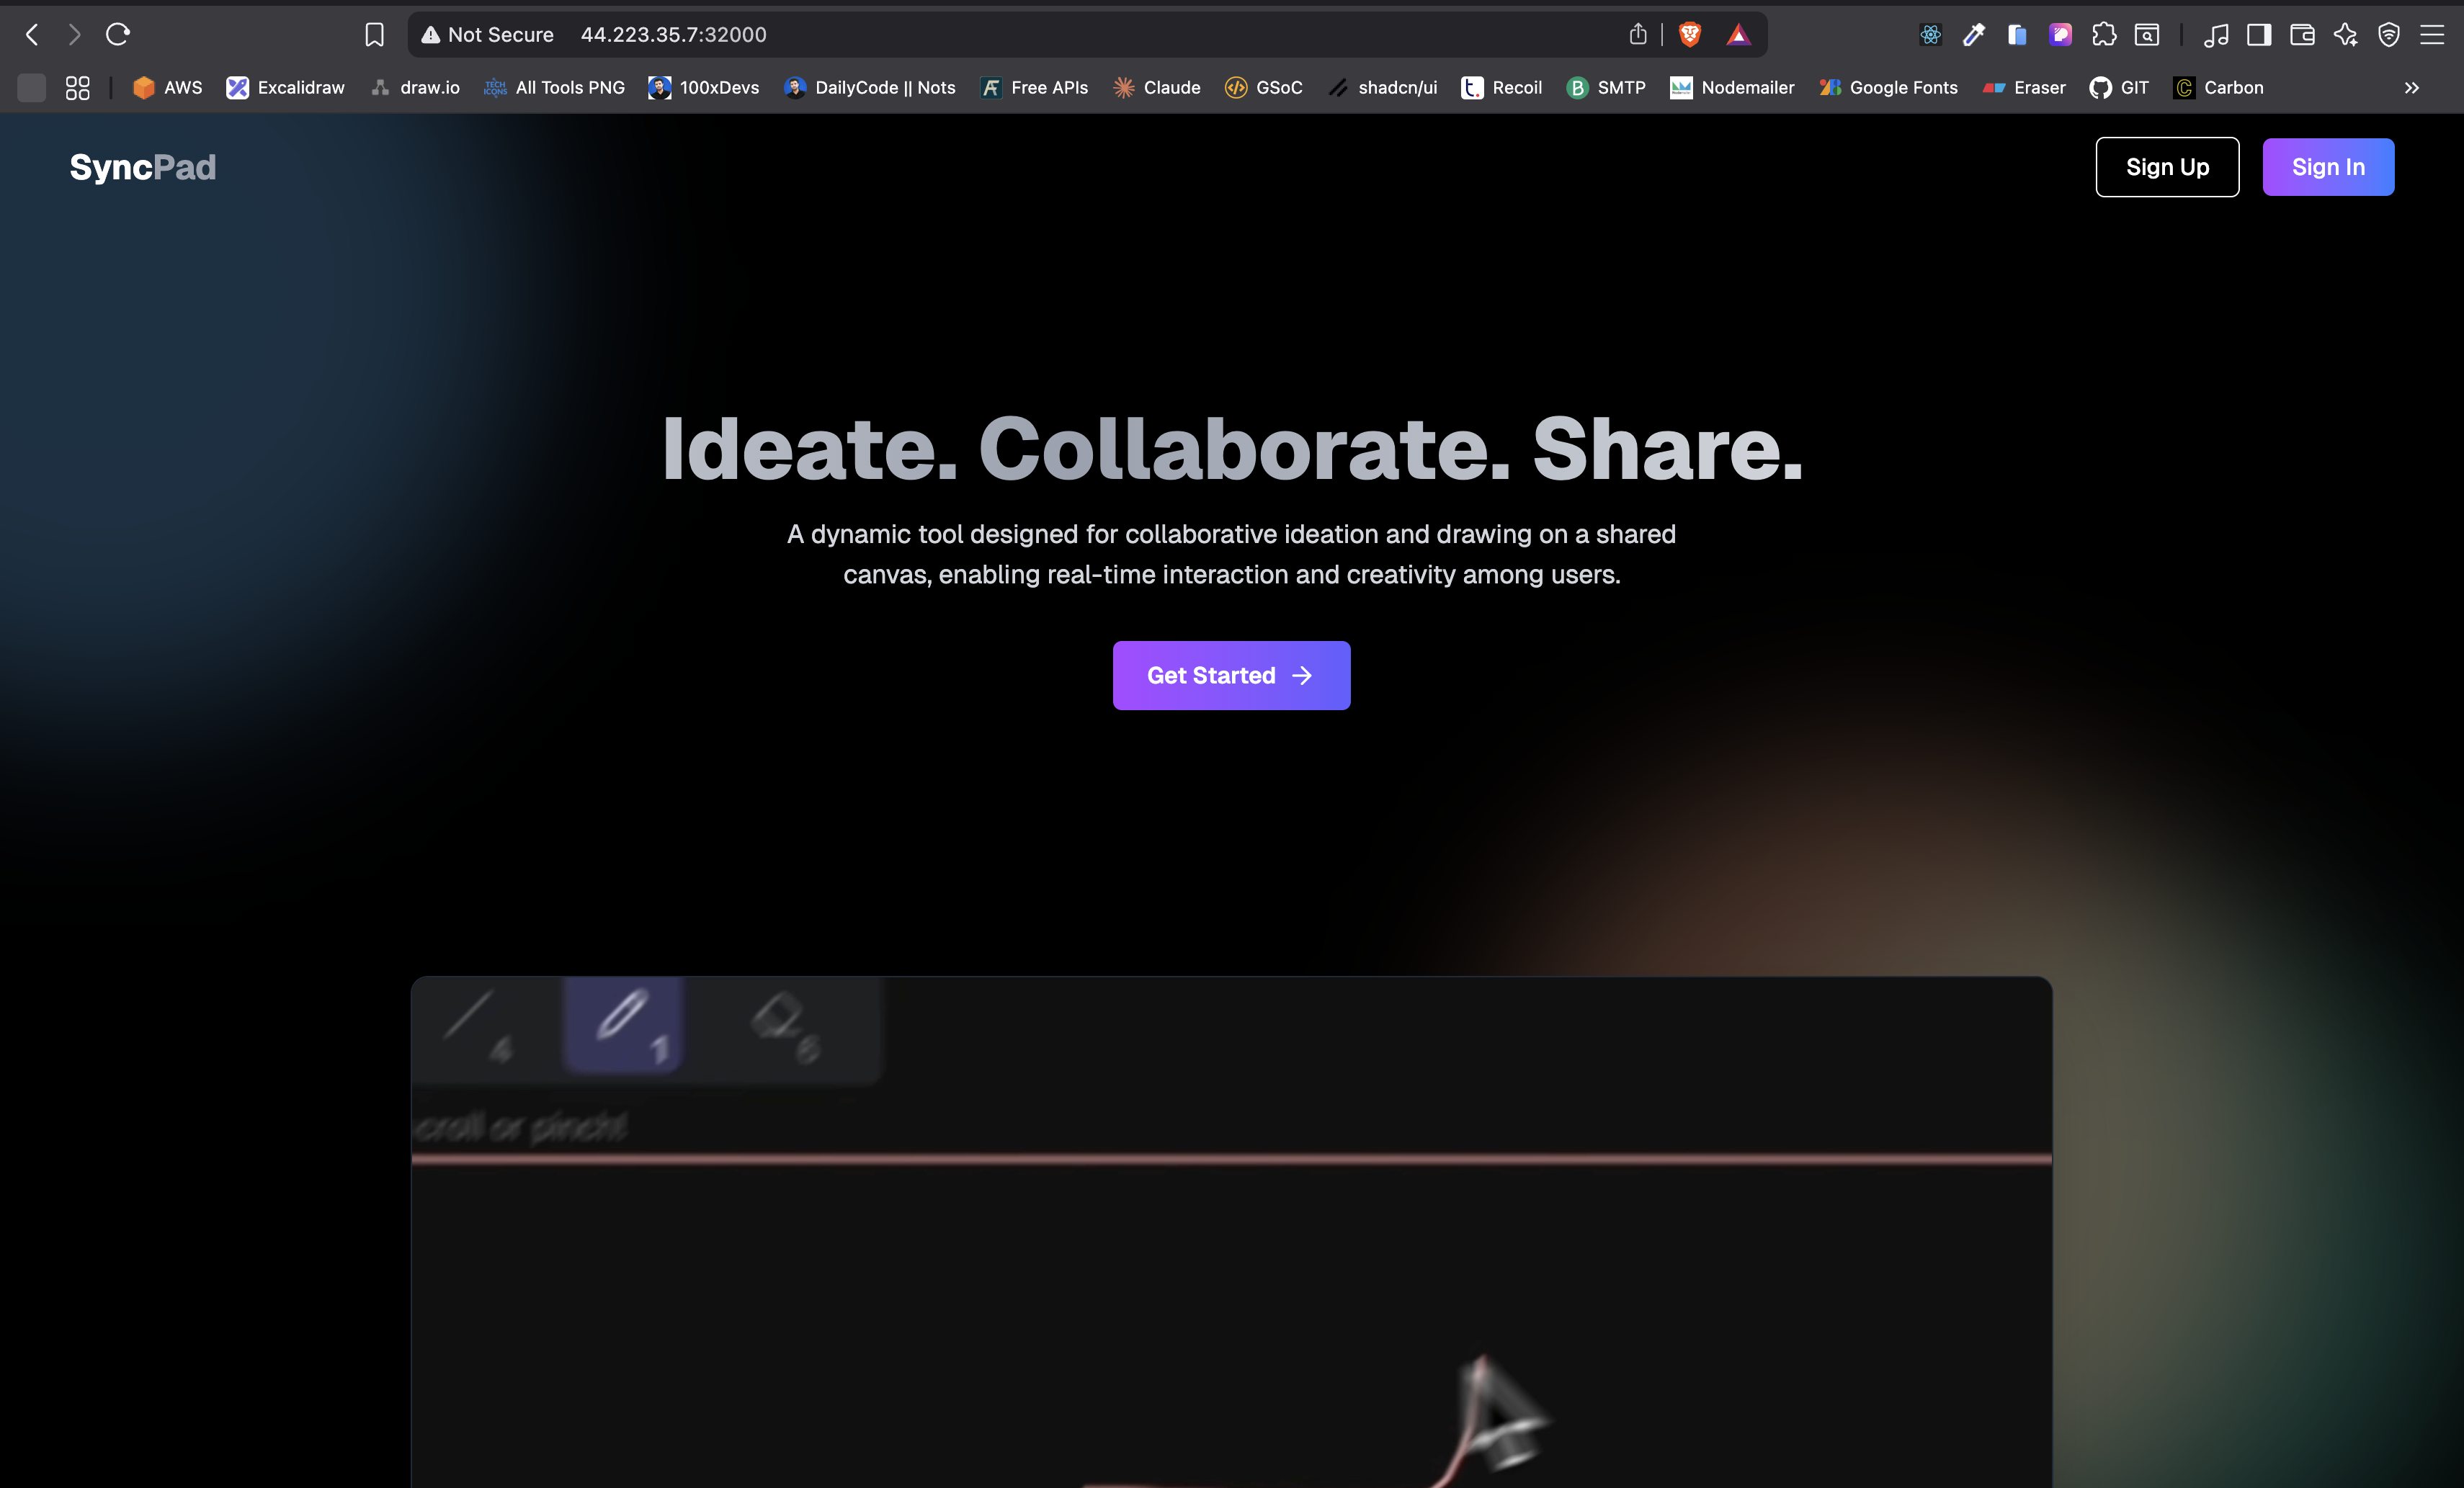
Click the image above to watch a full demo of SyncPad – a real-time collaborative drawing application powered by Next.js, Express, Tailwind CSS, and your own custom canvas sync logic.
- Monorepo with Turborepo
- Next.js – Frontend Framework
- Express – Custom Backend
- TypeScript – Type Safety
- Tailwind CSS – Styling
- Canvas API – Custom drawing logic (no external APIs)
- Prisma + PostgreSQL – For room/message persistence (optional/future use)
git clone https://github.com/Debjyoti2004/SyncPad.git
cd SyncPadnpm install -g pnpmFrom the project root:
pnpm install- Navigate to your project folder
cd packages/db - Create a .env file and add the following:
DATABASE_URL="your_postgres_url"From the db package
npx prisma migrate dev --name init
npx prisma generateFrom the root of the monorepo:
cd ...
pnpm build
pnpm dev
Your application should now be running at http://localhost:3000.
- 🎨 Real-time shared canvas
- 🧑🤝🧑 Multi-user collaboration
- ⚡ Instant synchronization (no lag)
- 🔐 Built using custom canvas sync logic (no third-party APIs)
- 🚀 Optimized with Turborepo for fast, scalable monorepo development
The prod branch includes full DevOps support, progressively adding:
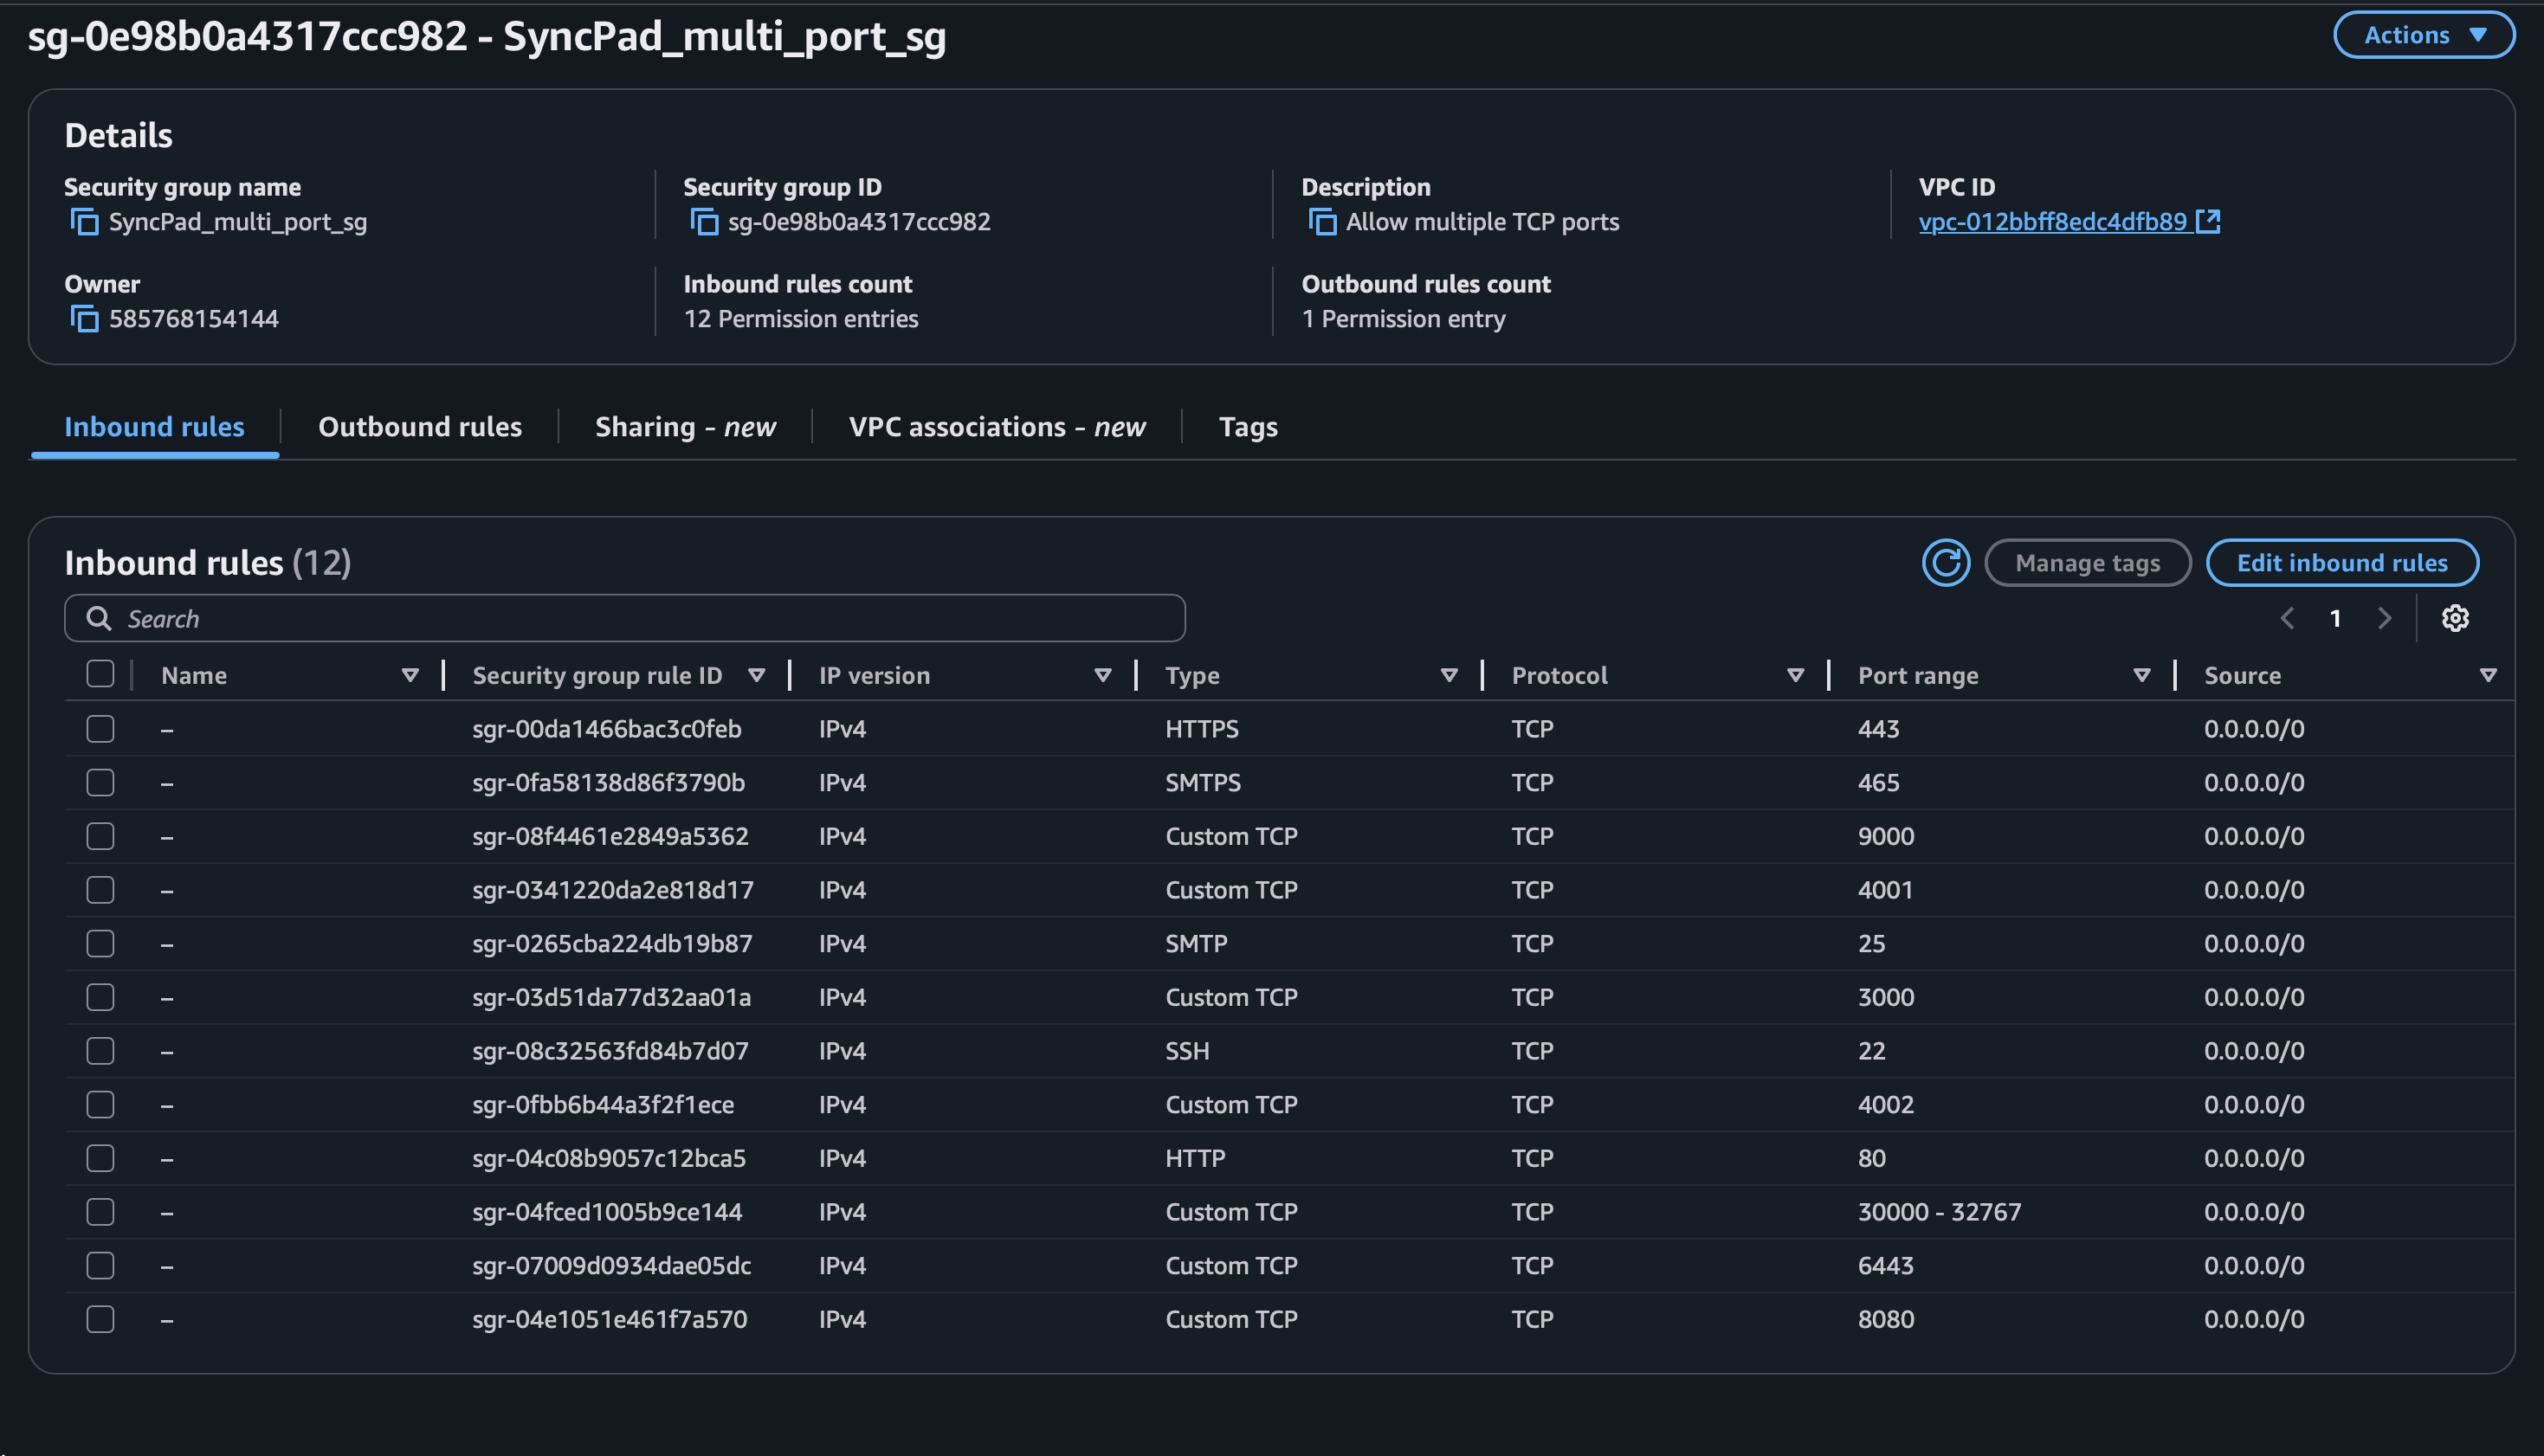
- ✅ CI/CD pipeline with Jenkins
- 🐳 Dockerized services (frontend, backend, WebSocket)
- 📦 PNPM workspace-aware multi-service build
- 🛡️ Security scans (Trivy, OWASP Dependency-Check)
- 🔍 Code quality analysis with SonarQube
- 🚦 Quality Gate with auto-pipeline enforcement
- ☁️ Kubernetes Deployment
- 🔄 WebSocket message queue (e.g., Redis or BullMQ (in progress))
- 📈 Centralized logging + metrics (Prometheus + Grafana)
- ✅ Code Commit: Developer pushes code to GitHub.
- ⚙️ Jenkins CI: Triggers automated build and testing pipeline.
- Runs dependency checks (OWASP)
- Scans vulnerabilities (Trivy)
- Code quality analysis (SonarQube)
- 🐳 Docker: Builds and pushes Docker image to registry.
- 🔁 Jenkins CD: Updates version and triggers deployment.
- 📦 ArgoCD: Pulls new version and deploys to Kubernetes.
- 🧠 Monitoring: Prometheus + Grafana monitor live performance.
- 📬 Notifications: Gmail alerts are sent post-deployment.
All steps are automated and version-controlled, ensuring production-ready, secure deployments with zero manual intervention.
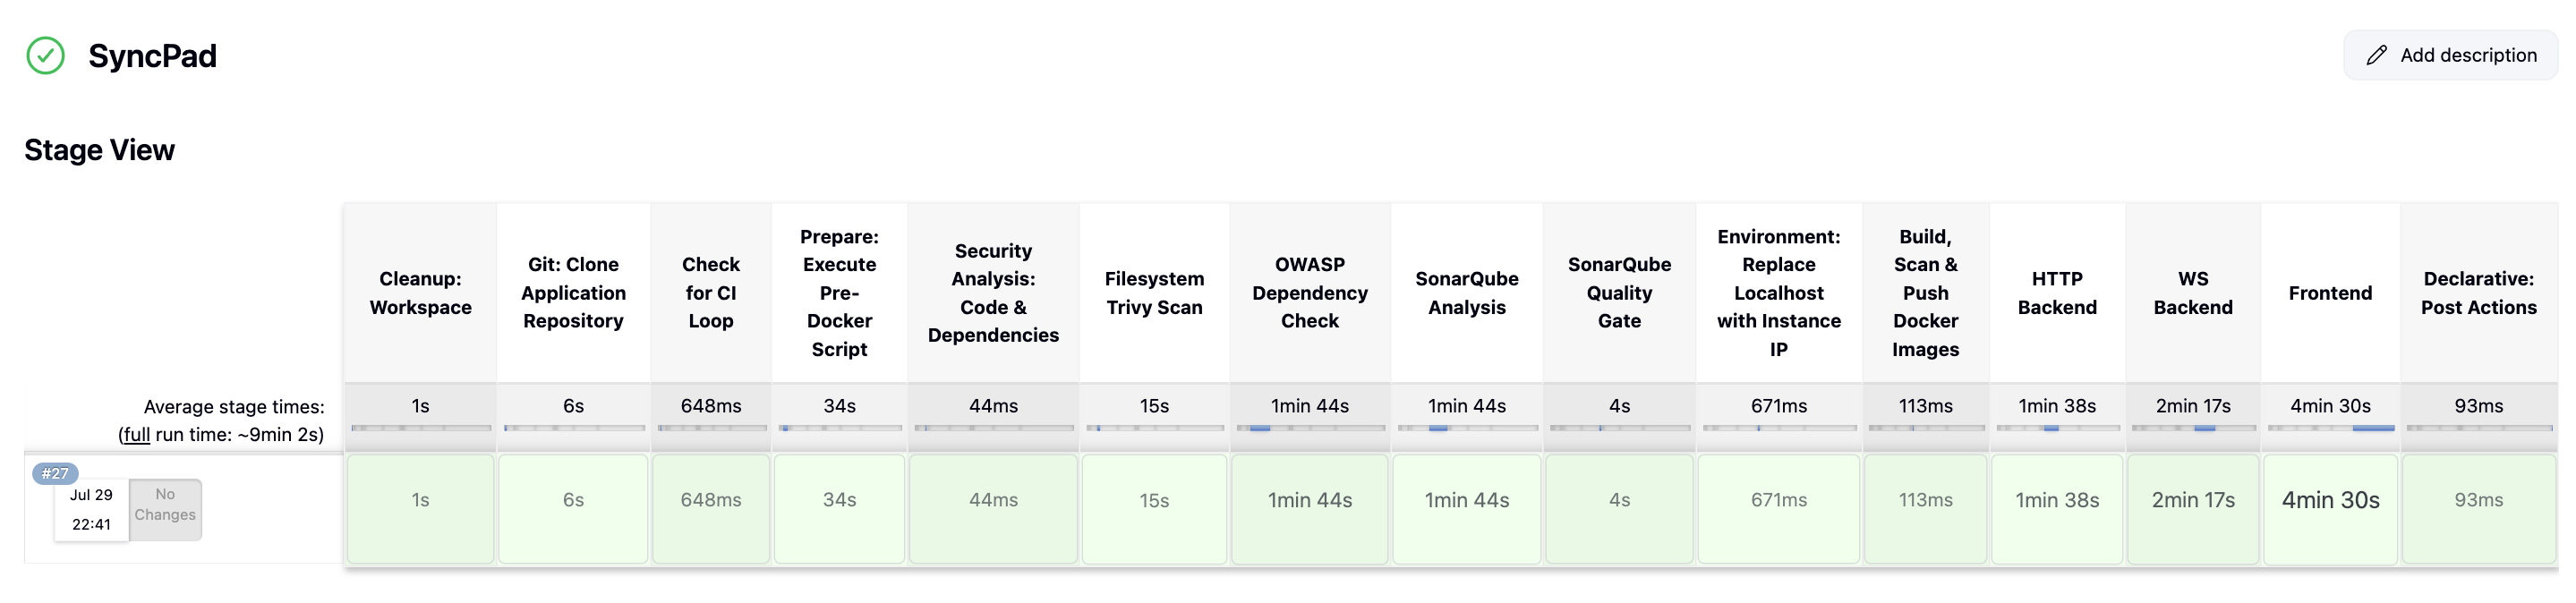
The CI pipeline is triggered when code is pushed to GitHub. It builds the project, performs security scans, and pushes the Docker image to the container registry.
ssh-keygen -f SyncPad-keyThis will generate SyncPad-key and SyncPad-key.pub. You'll use this to access your AWS EC2 instance.
terrafrom init
terrafrom plan
terrafrom apply
After applying, Terraform will create:
1 EC2 instance (Ubuntu) in us-east-1 region
Instance type: t2.large (2 vCPU, 8 GB RAM)
Storage: 29 GB SSD
ssh -i SyncPad-key ubuntu@<EC2_PUBLIC_IP>sudo apt-get update -ygit clone https://github.com/Debjyoti2004/SyncPad.git
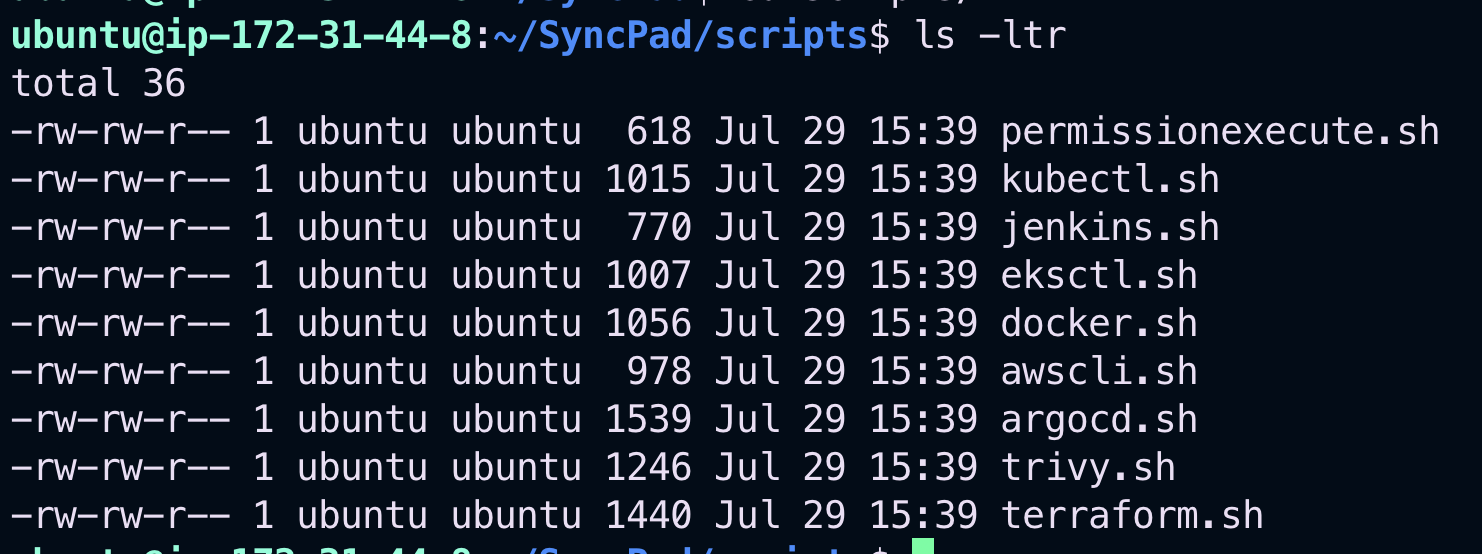
cd SyncPad/scripts
Here’s how the files look before applying execution permissions:
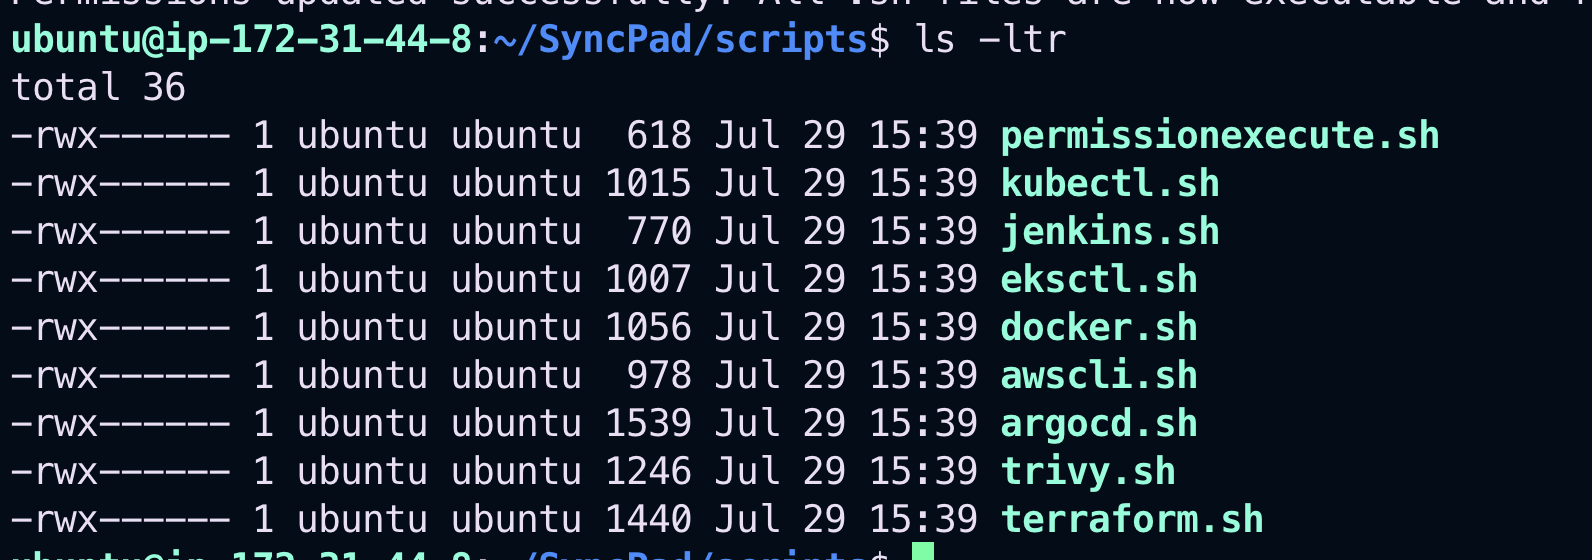
chmod +x permissionexecute.sh
./permissionexecute.sh
This script grants executable permissions to all necessary setup scripts in the folder.
You’ll see that all scripts now have executable permission:
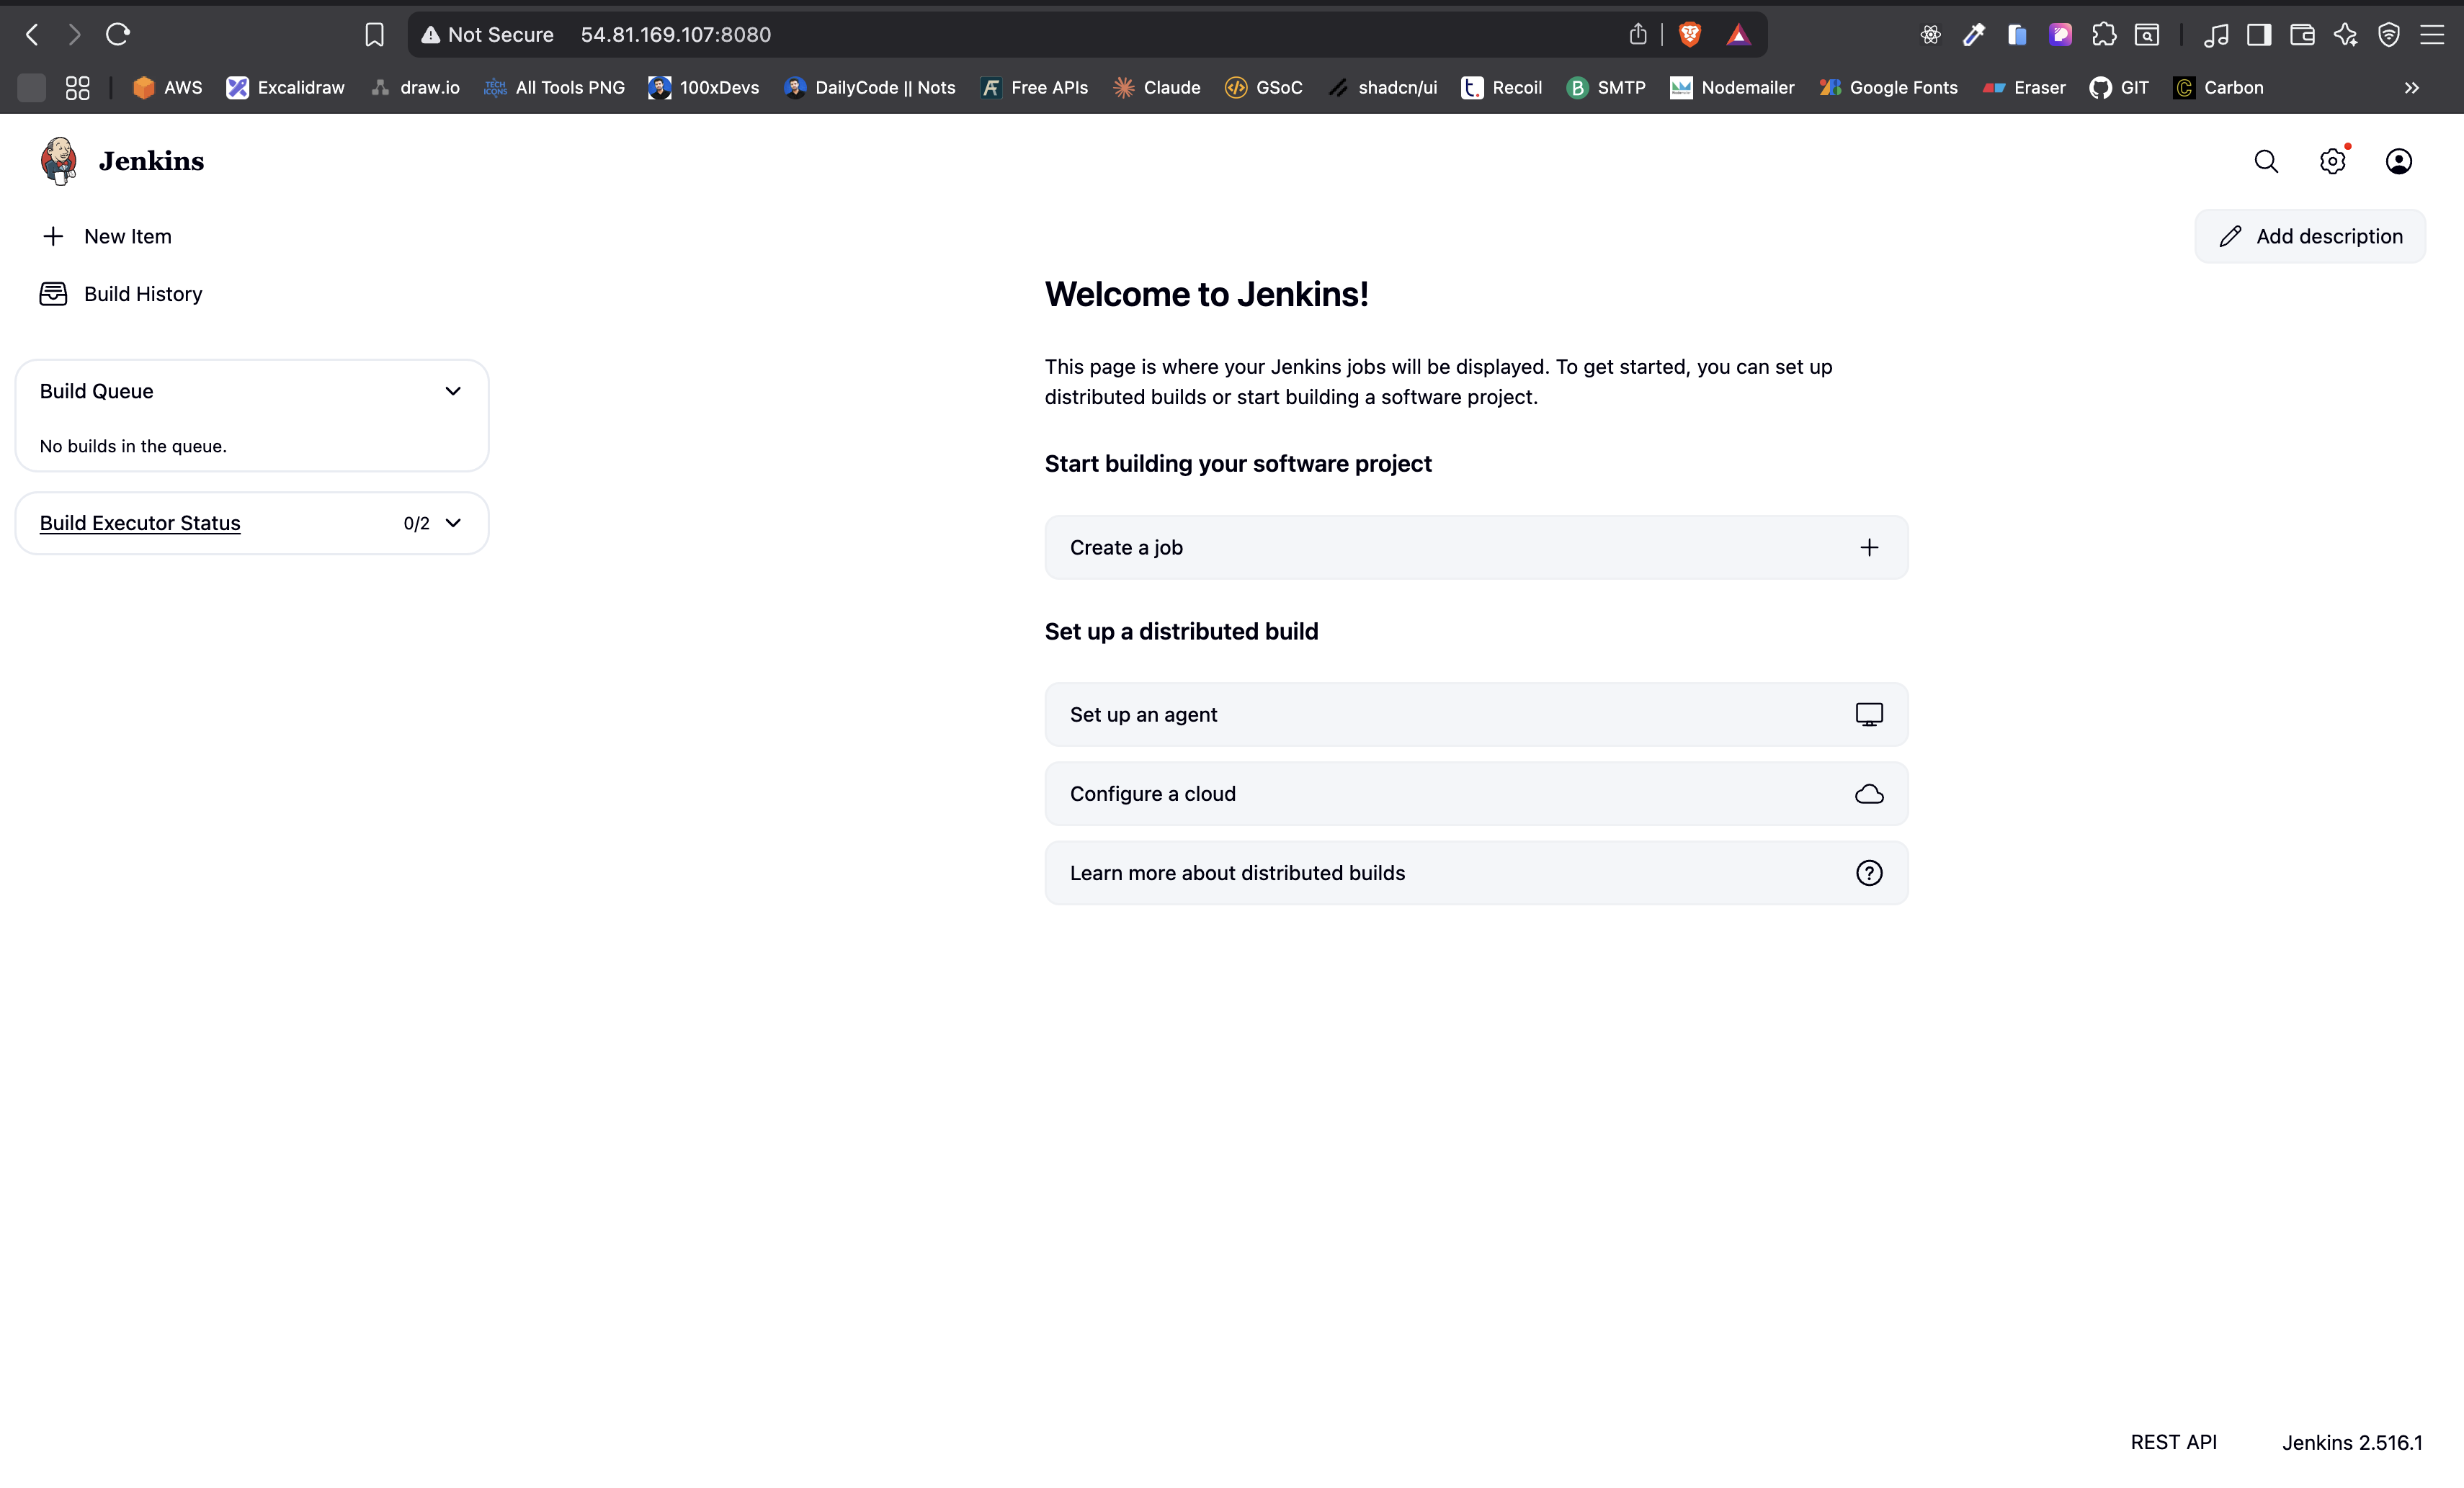
Once Docker is up and running, install Jenkins using the provided script.
./jenkins.shhttp://<EC2_PUBLIC_IP>:8080Tip: If the page doesn't load immediately, give it a minute or two — Jenkins takes some time on the first startup.
Let's begin by installing our very first DevOps tool: Docker.
All necessary steps are scripted inside the docker.sh file — including the setup for SonarQube using Docker.
./docker.sh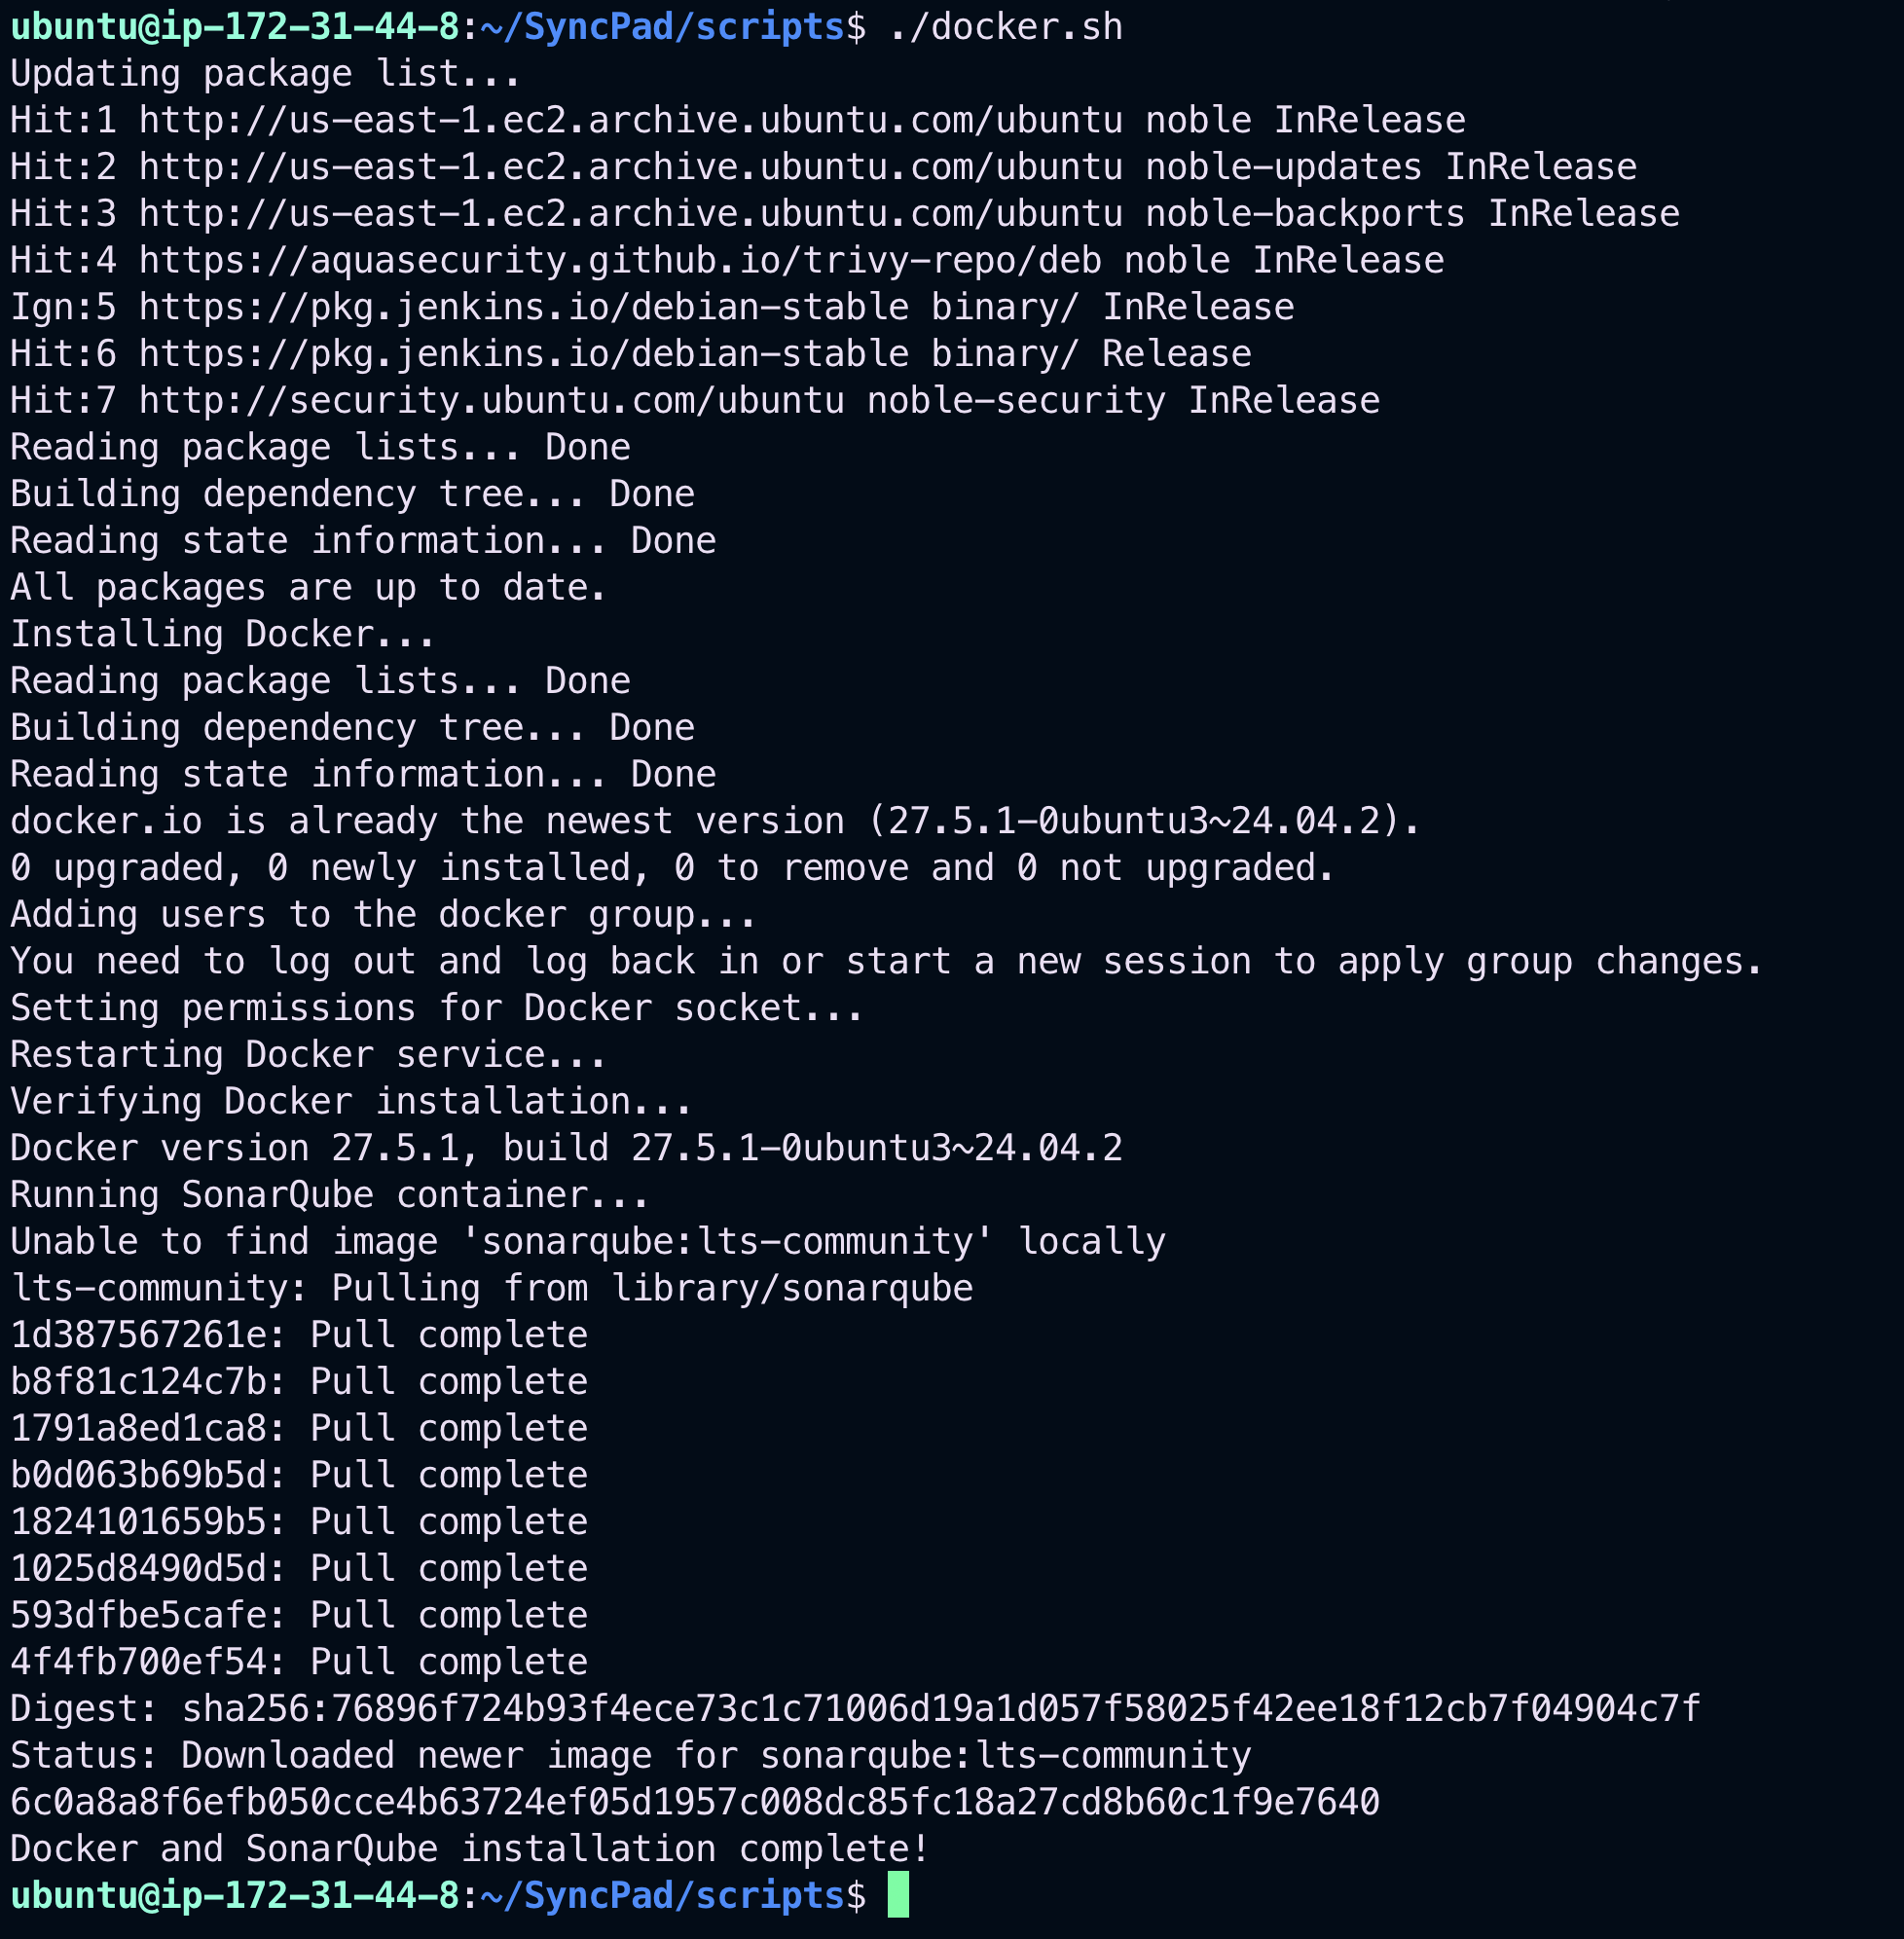
To run Docker without using sudo every time:
sudo usermod -aG docker $USER && newgrp docker
http://<EC2_PUBLIC_IP>:9000Before provisioning the EKS cluster and node groups, we need to configure some AWS tools and credentials.
This key pair will be used later to access nodes provisioned inside your EKS cluster.
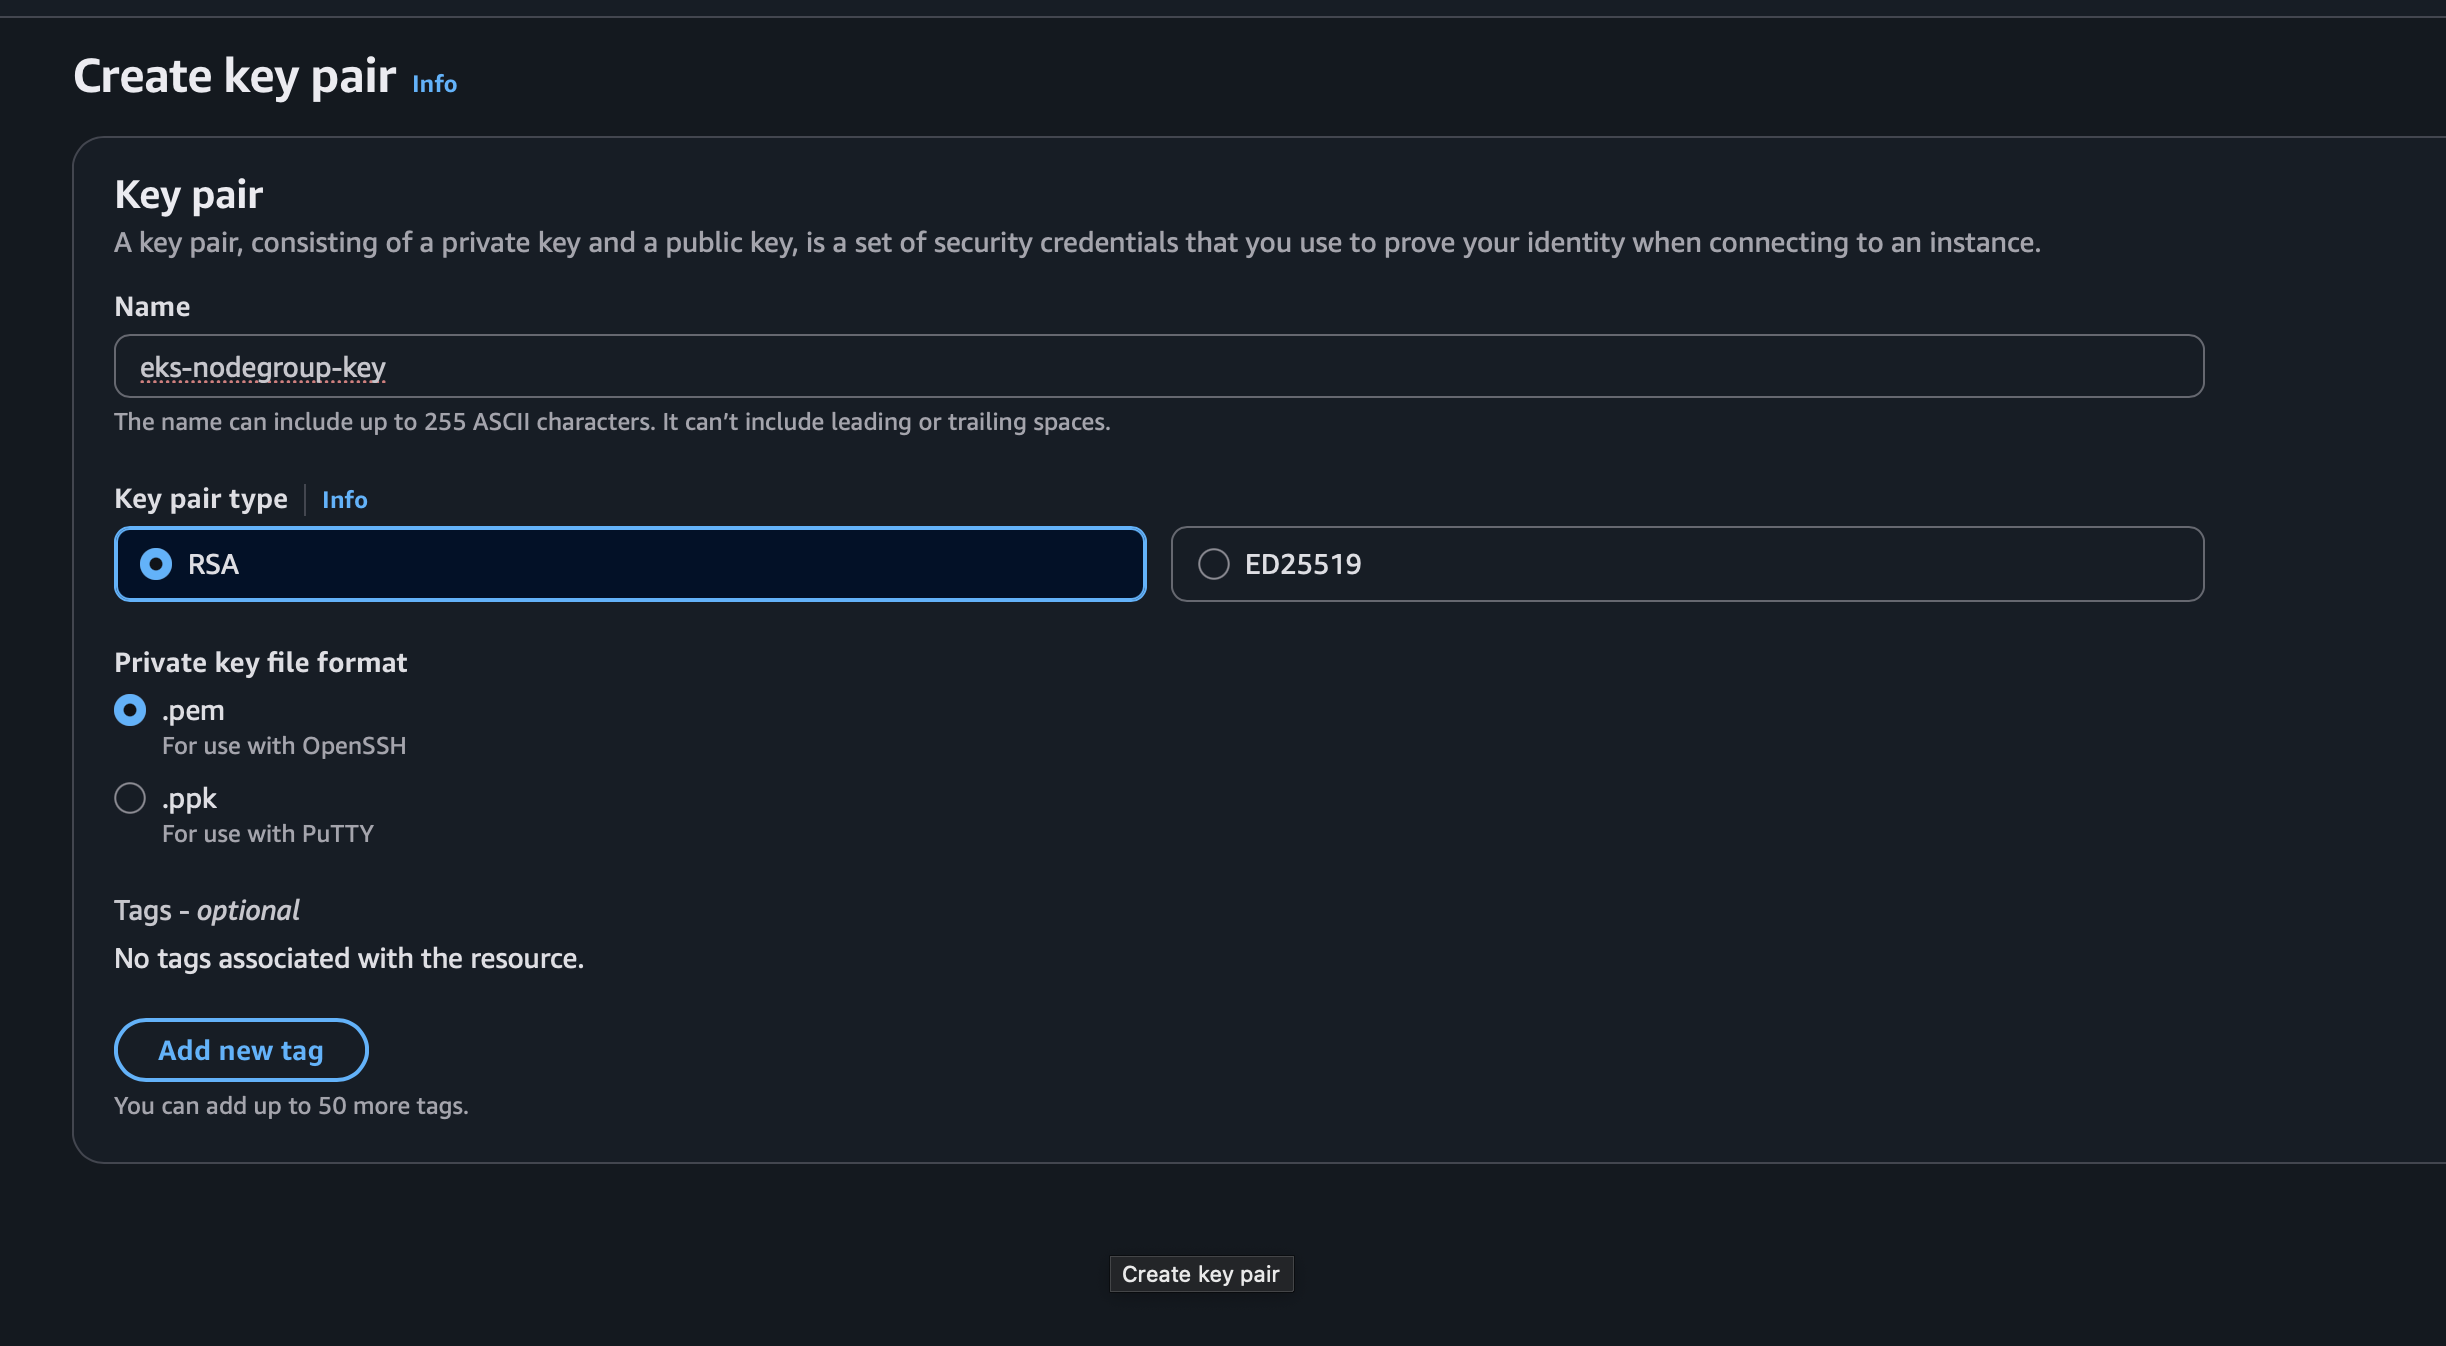
- Go to the AWS Console → IAM → Create a user with programmatic access
- Attach the AdministratorAccess policy
- Download and store the Access Key ID and Secret Access Key securely
(You'll use them to configure the AWS CLI)
./awscli.shaws configureProvide the following when prompted:
AWS Access Key ID [None]: <YOUR_ACCESS_KEY_ID> AWS Secret Access Key [None]: <YOUR_SECRET_ACCESS_KEY> Default region name [None]: us-east-1 Default output format [None]: json
./kubectl.sh./eksctl.shOnce your AWS CLI, kubectl, and eksctl are installed and configured, you can create your EKS cluster and attach a node group.
eksctl create cluster --name=SyncPad \
                      --region=us-east-1 \
                      --version=1.30 \
                      --without-nodegroup
This command will create an empty EKS control plane named SyncPad in us-east-1 without any worker nodes.
OIDC is required for fine-grained IAM roles and service account integration with tools like ArgoCD, ALB Ingress Controller, etc.
eksctl utils associate-iam-oidc-provider \
  --region us-east-1 \
  --cluster SyncPad \
--approveThis will provision 2 EC2 instances (t2.large) and attach them to the SyncPad cluster.
eksctl create nodegroup --cluster=SyncPad \
                     --region=us-east-1 \
                     --name=SyncPad \
                     --node-type=t2.large \
                     --nodes=2 \
                     --nodes-min=2 \
                     --nodes-max=2 \
                     --node-volume-size=29 \
                     --ssh-access \
--ssh-public-key=eks-nodegroup-key kubectl get nodesTo install and run Trivy on your system, use the provided script:
./trivyThis will install Trivy and allow you to run vulnerability scans on your Docker images like so:
trivy image your-image-name./argocdThis script will:
- Install Argo CD in its own argocd namespace
- Expose the Argo CD server on a NodePort
- Install the Argo CD CLI
- Print out the exposed services and the admin password
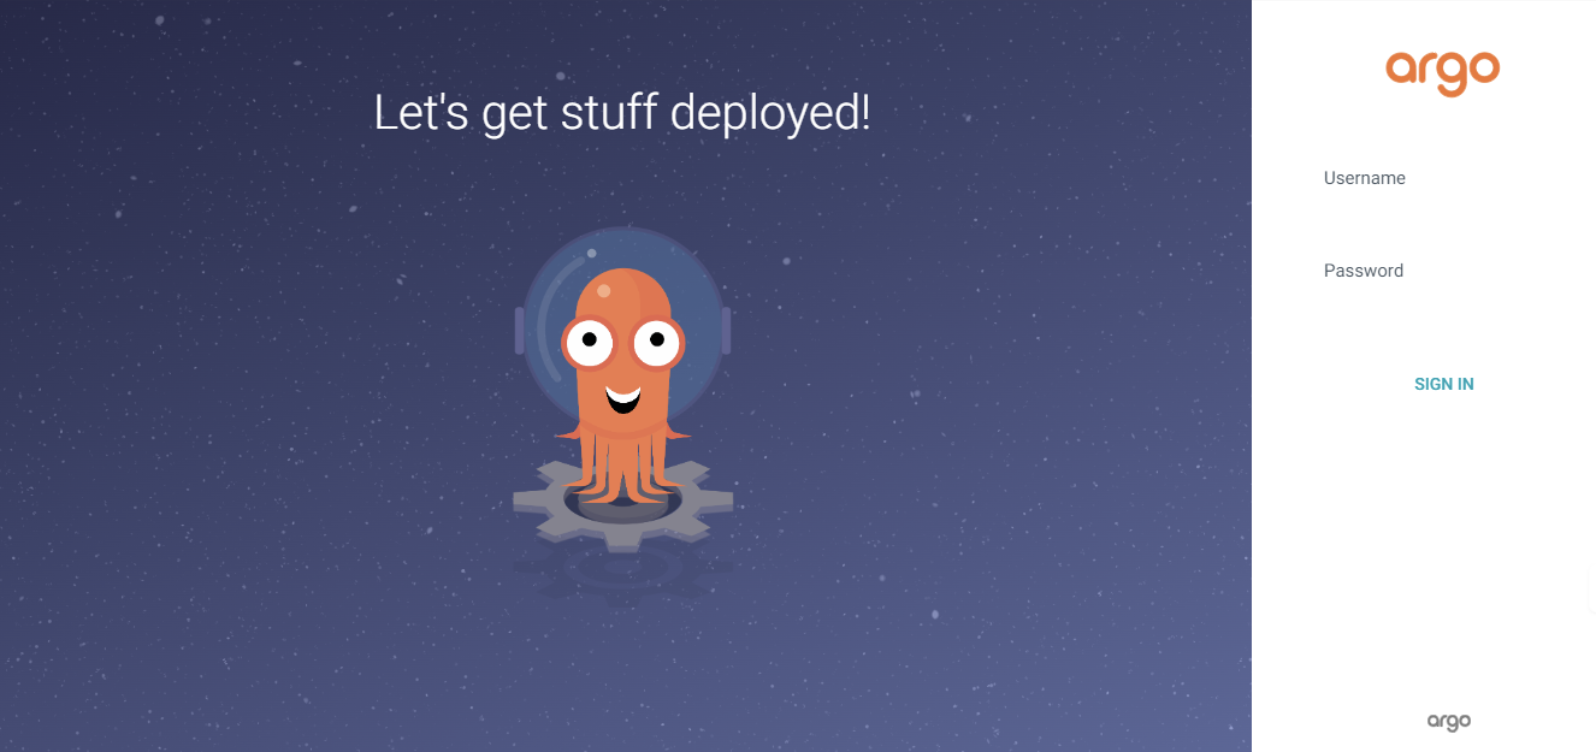
🏠 Home Page
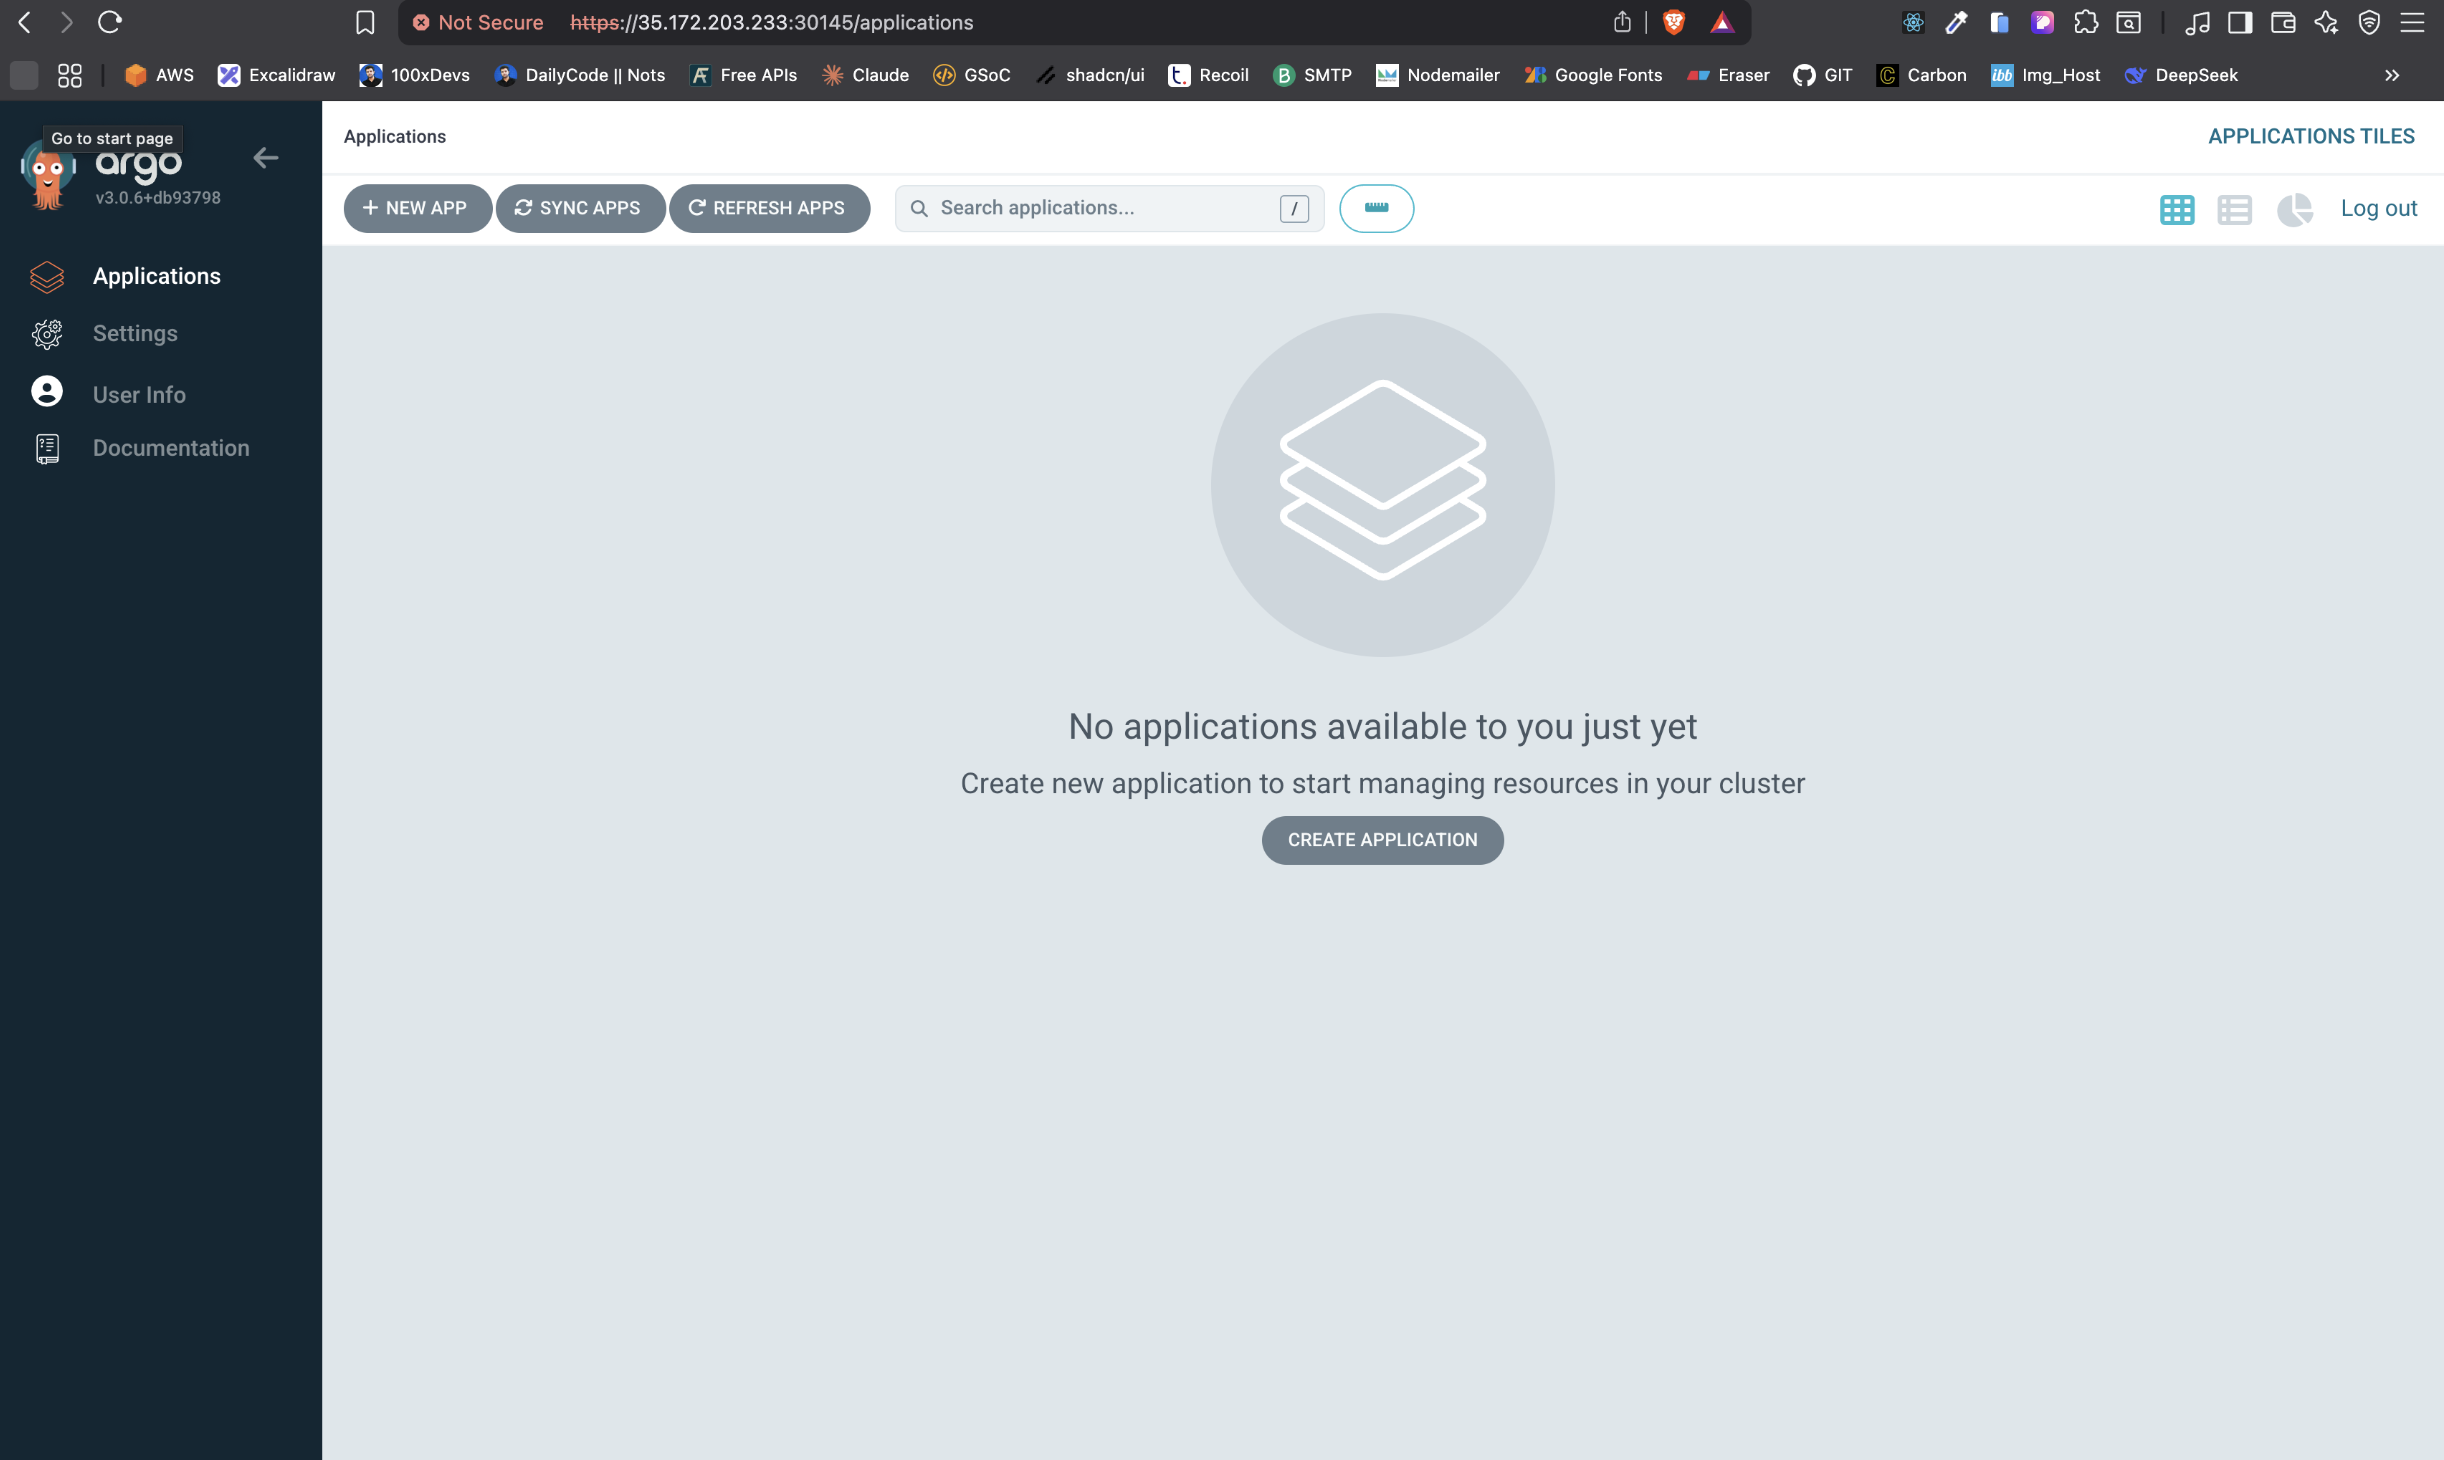
✅ After Login
Run this command (already included at the end of the ./argocd script):
kubectl -n argocd get secret argocd-initial-admin-secret \
  -o jsonpath="{.data.password}" | base64 -d; echo
http://<your-node-ip>:<node-port>- Username: admin
- Password: (output from above command)
Now you can log into Argo CD at:
- Now, go to User Info and update your argocd password
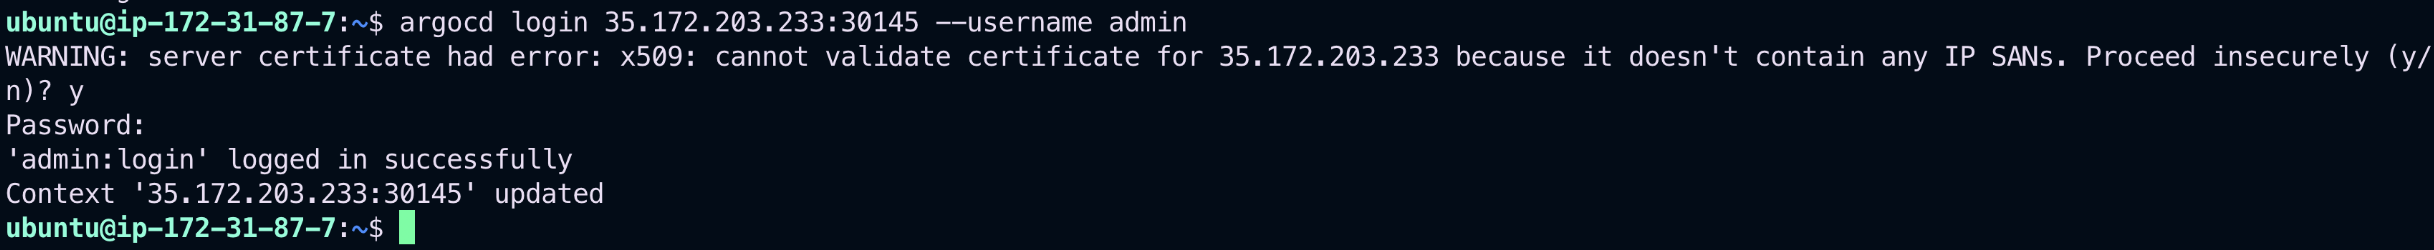
Use the following command to log in to your ArgoCD server:
argocd login <ARGOCD_SERVER> --username admin --password <PASSWORD>📷 Login Screenshot:
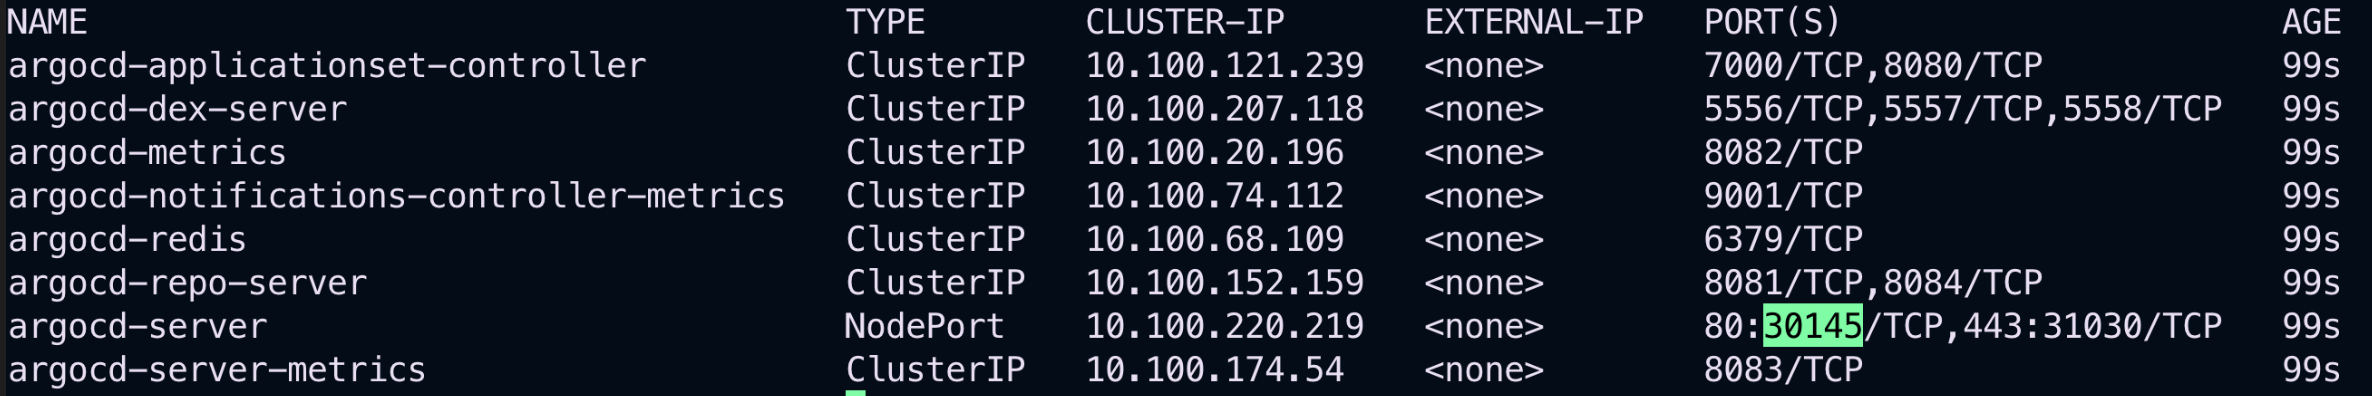
To check all the ArgoCD-related services running in your cluster:
kubectl get svc -n argocd📷 All ArgoCD Services:
To list all registered clusters with ArgoCD:
argocd cluster list📷 ArgoCD Cluster Screenshot:

📊 How to Monitor EKS Cluster, Kubernetes Components, and Workloads Using Prometheus & Grafana via Helm
curl -fsSL -o get_helm.sh https://raw.githubusercontent.com/helm/helm/main/scripts/get-helm-3
chmod 700 get_helm.sh
./get_helm.shhelm repo add stable https://charts.helm.sh/stable
helm repo add prometheus-community https://prometheus-community.github.io/helm-charts
helm repo updatekubectl create namespace prometheus
kubectl get nshelm install stable prometheus-community/kube-prometheus-stack -n prometheusWait for a bit and check if the pods are running:
kubectl get pods -n prometheuskubectl get svc -n prometheusInitially, both services will be of type ClusterIP (not accessible externally).
By default, both services are internal. You need to expose them externally using NodePort.
Prometheus:
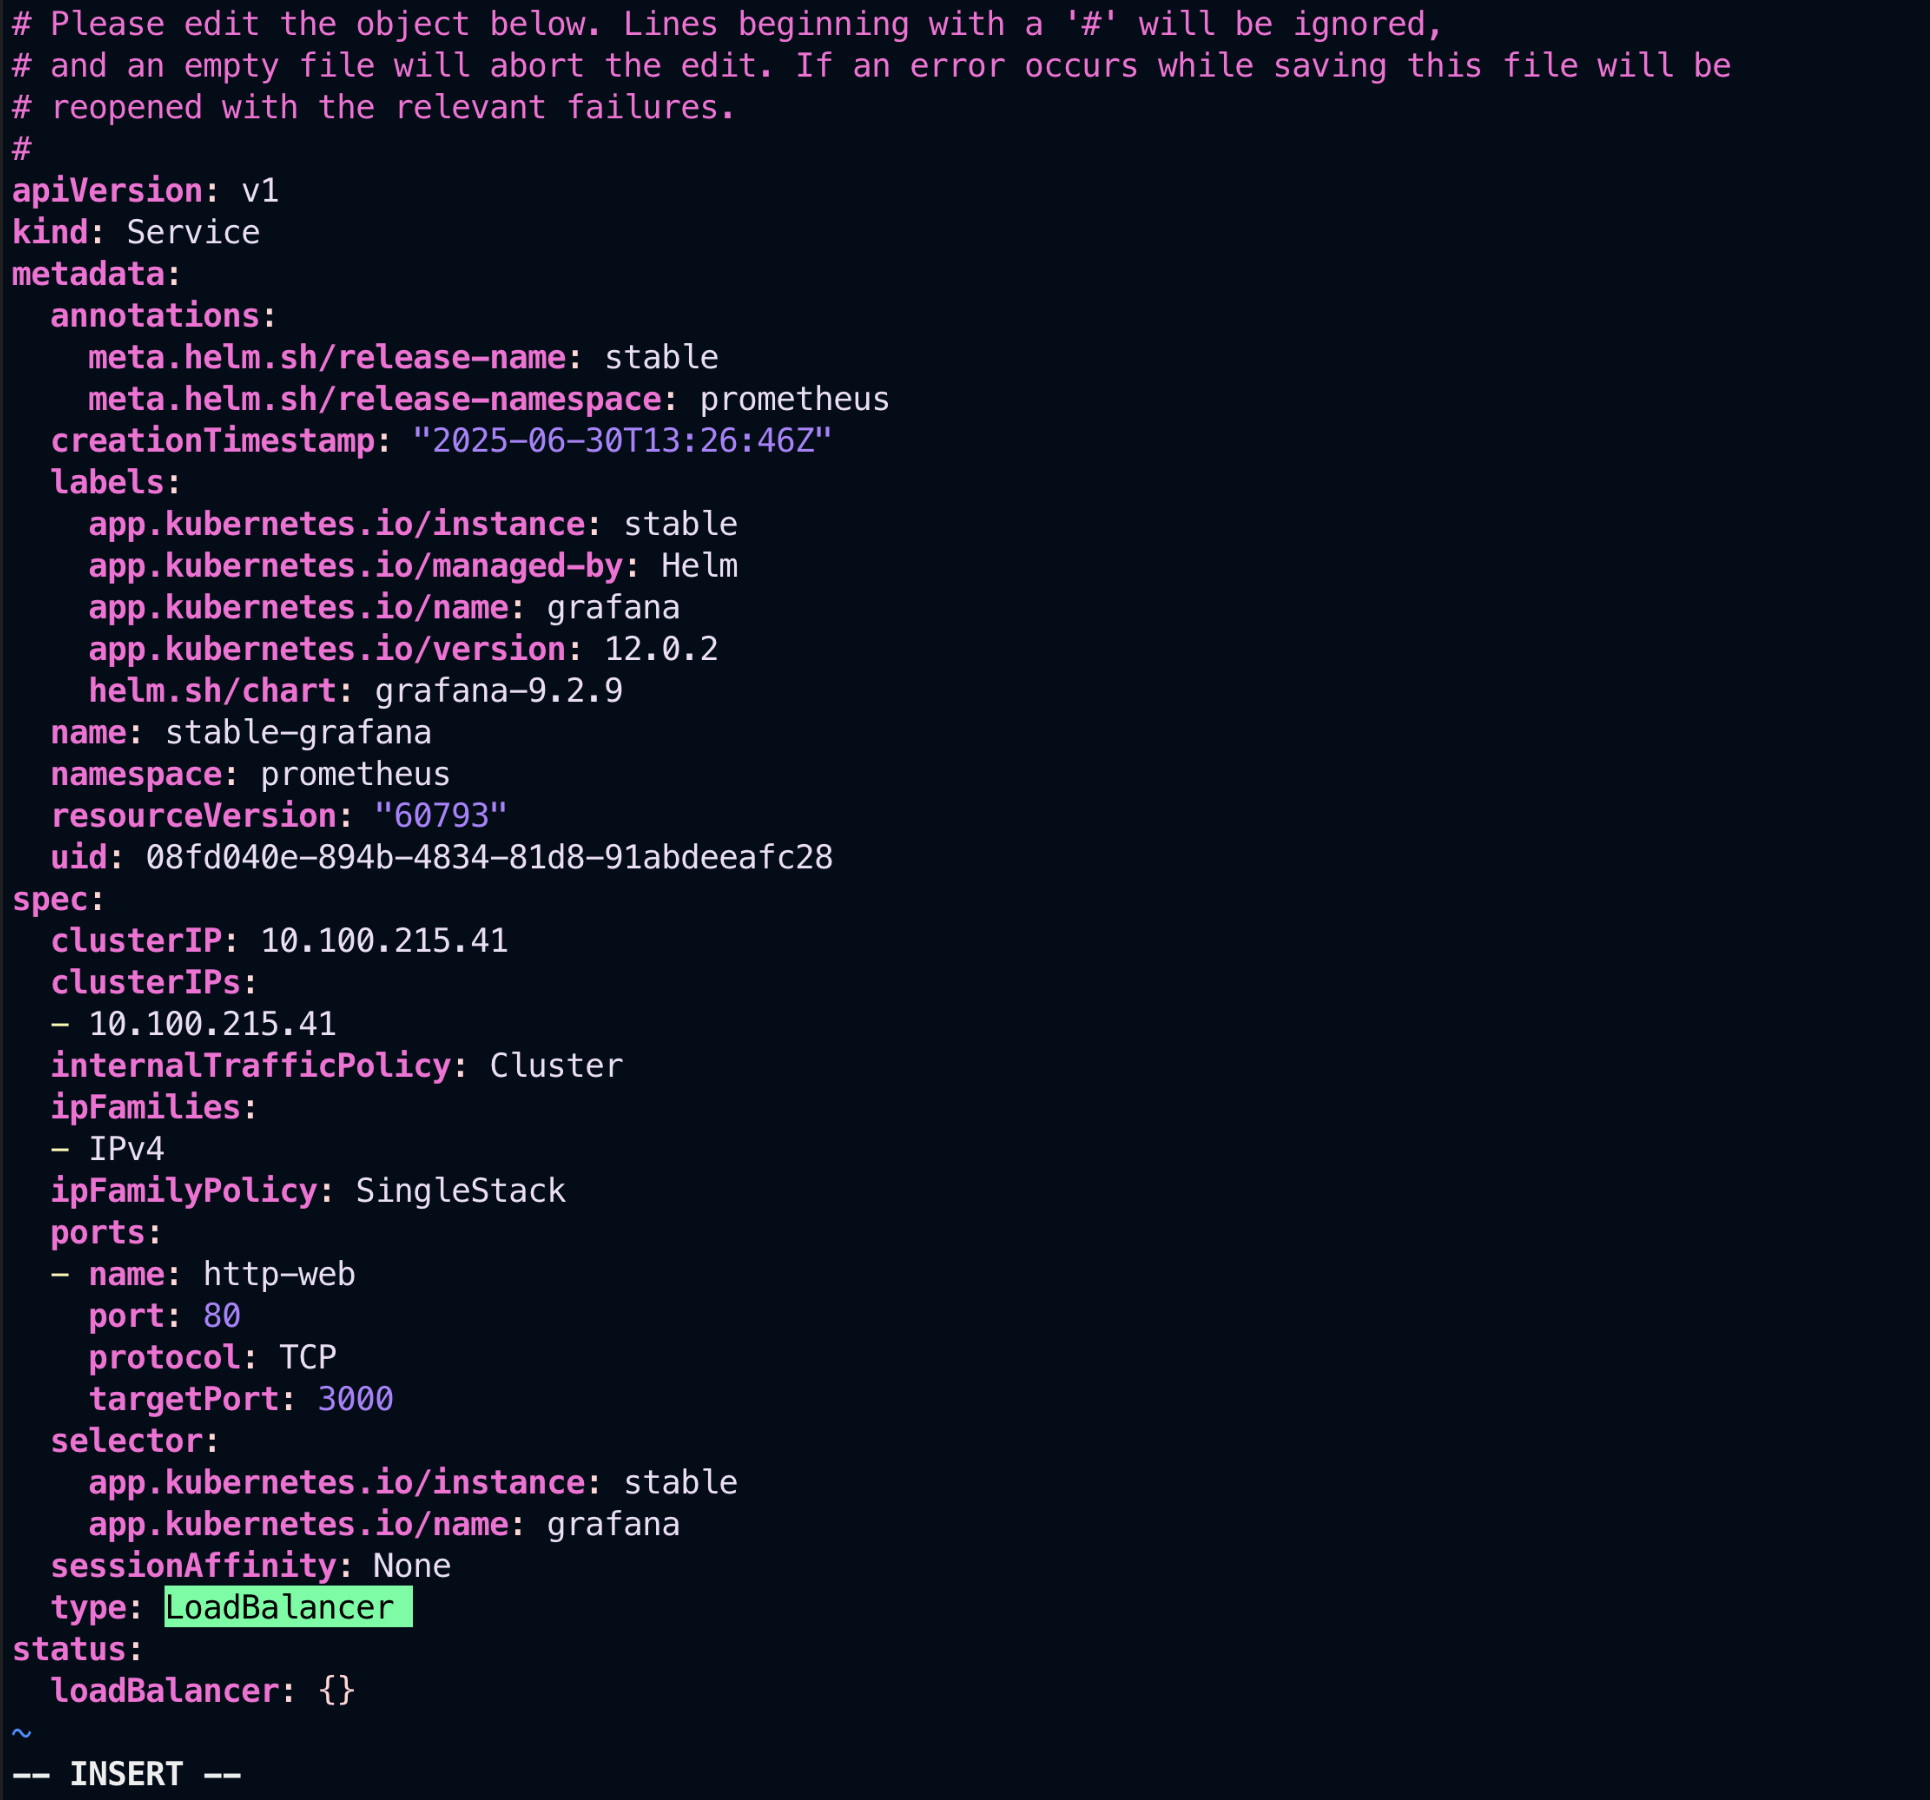
kubectl edit svc stable-kube-prometheus-sta-prometheus -n prometheusGrafana:
kubectl edit svc stable-grafana -n prometheusIn the YAML that opens, change:
type: ClusterIPto:
type: NodePort📷 After Changing to NodePort:
kubectl patch svc stable-kube-prometheus-sta-prometheus -n prometheus -p '{"spec": {"type": "NodePort"}}'
kubectl patch svc stable-grafana -n prometheus -p '{"spec": {"type": "NodePort"}}'kubectl get svc -n prometheusLook for the NodePort value assigned to Prometheus and Grafana.
Use the EC2 public IP and NodePort to access:
- Grafana:
http://<EC2_PUBLIC_IP>:<Grafana_NodePort> - Prometheus:
http://<EC2_PUBLIC_IP>:<Prometheus_NodePort>
By default, the username is admin. You can get the password with:
kubectl get secret --namespace prometheus stable-grafana -o jsonpath="{.data.admin-password}" | base64 --decode ; echoOnce exposed, access Grafana from your browser:
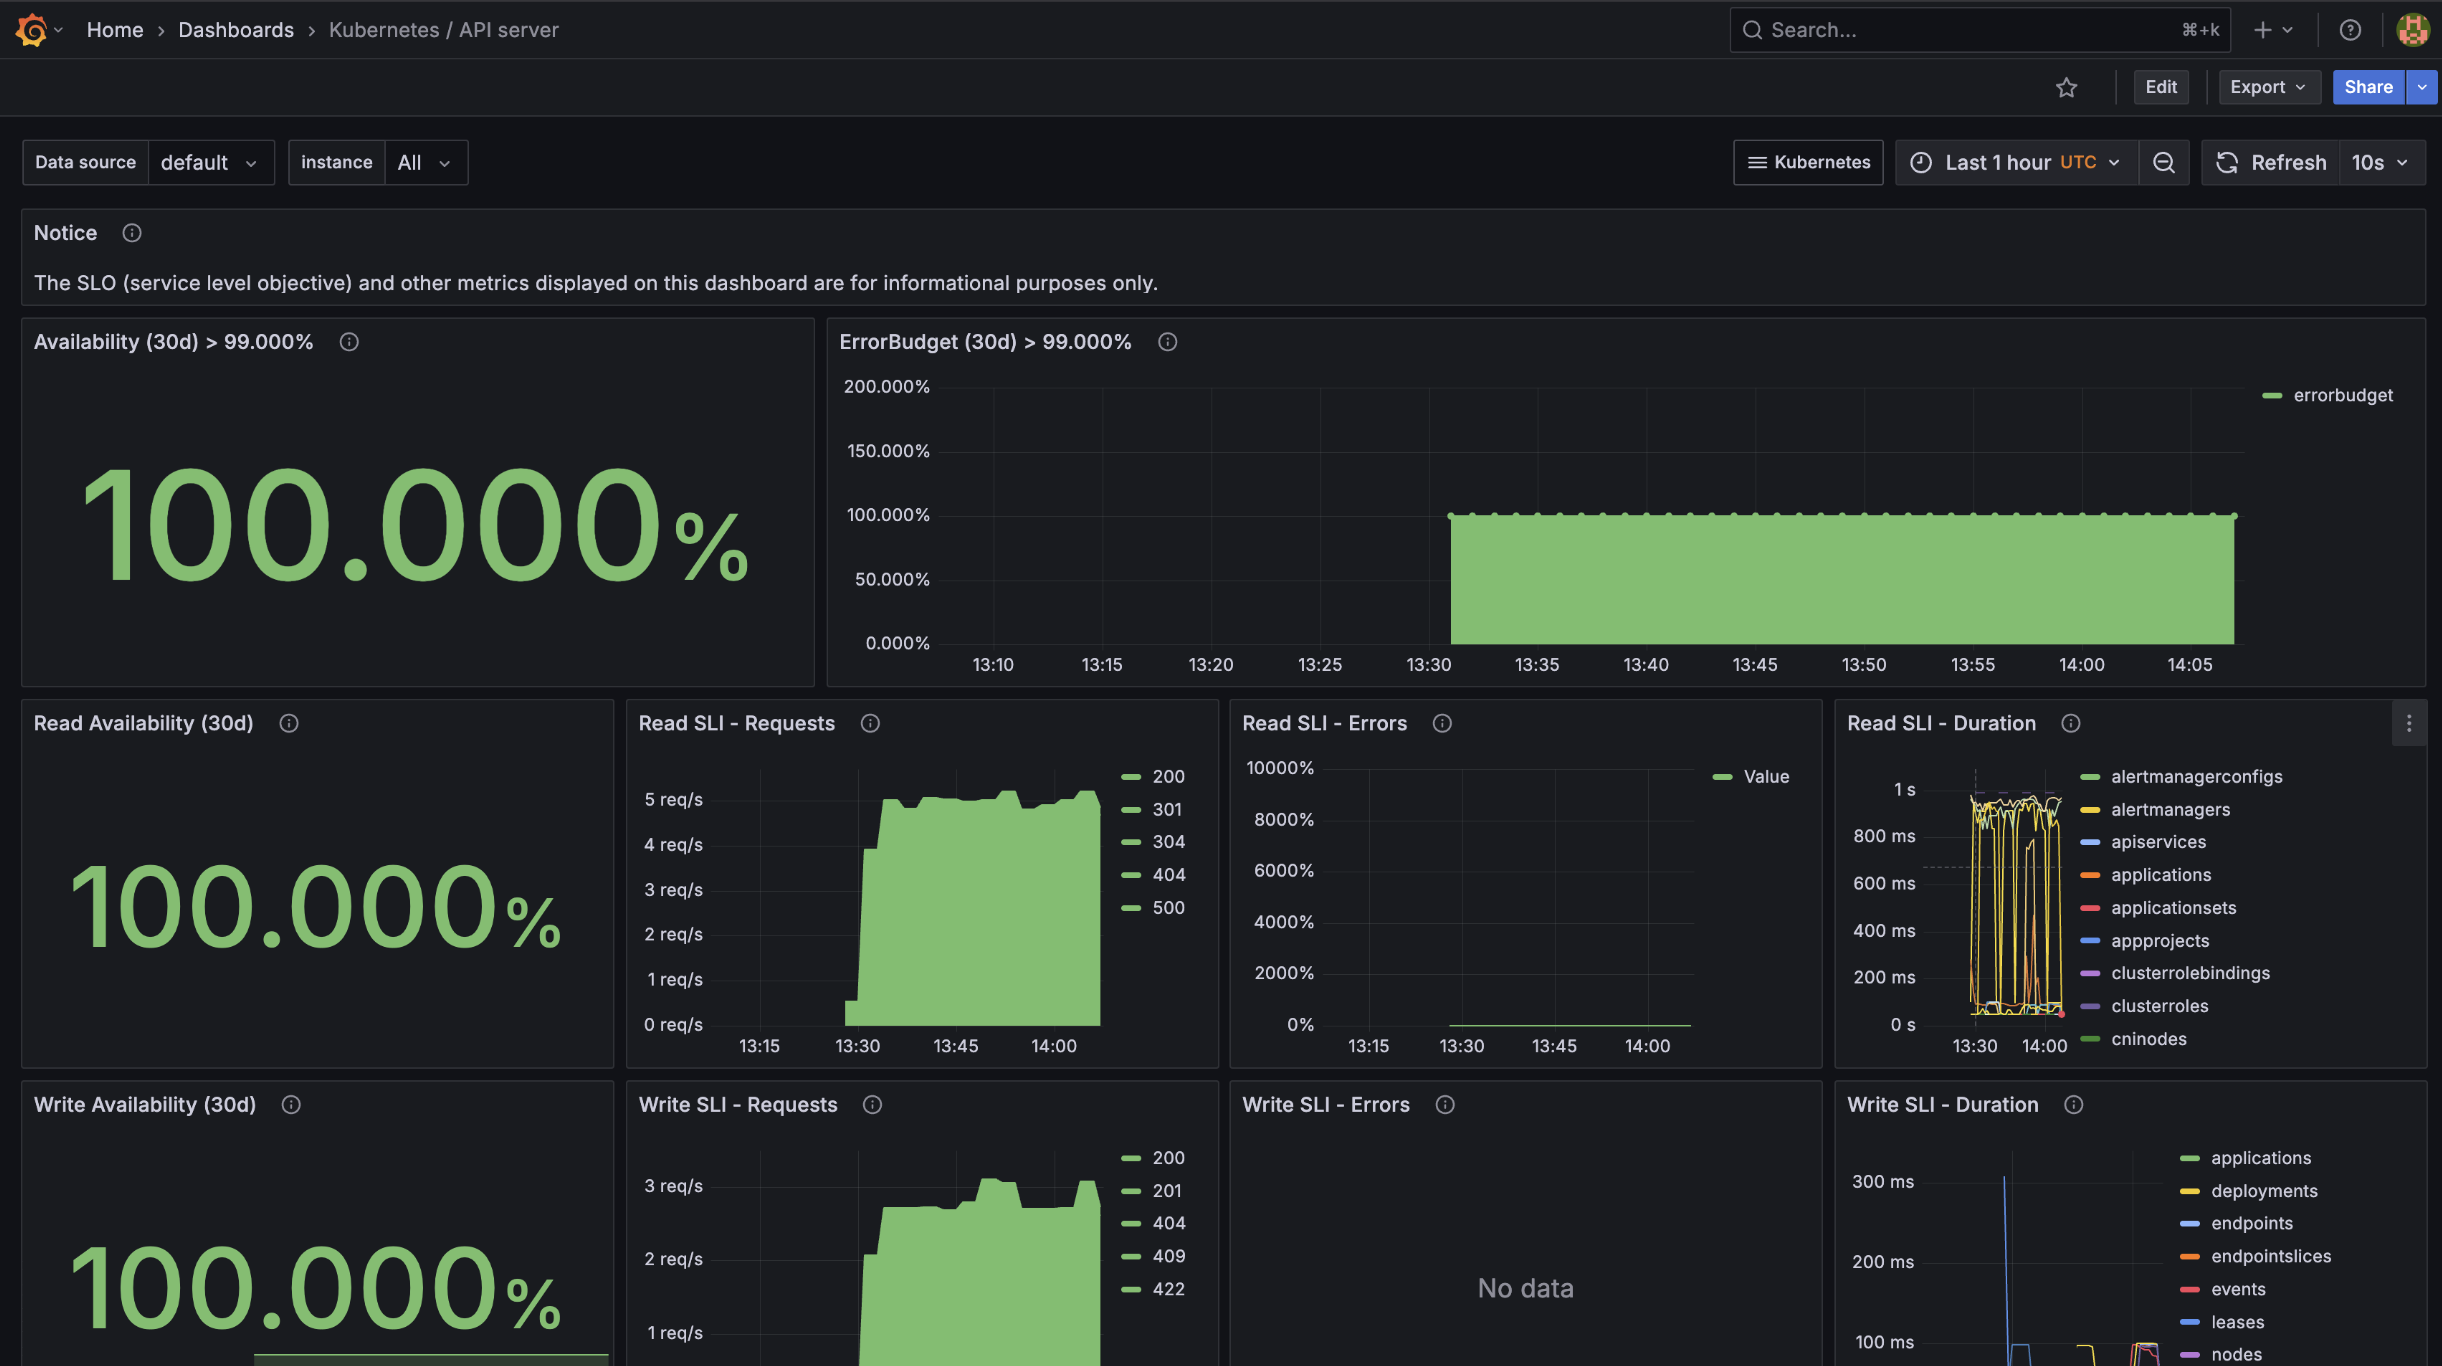
📷 Grafana Dashboard:
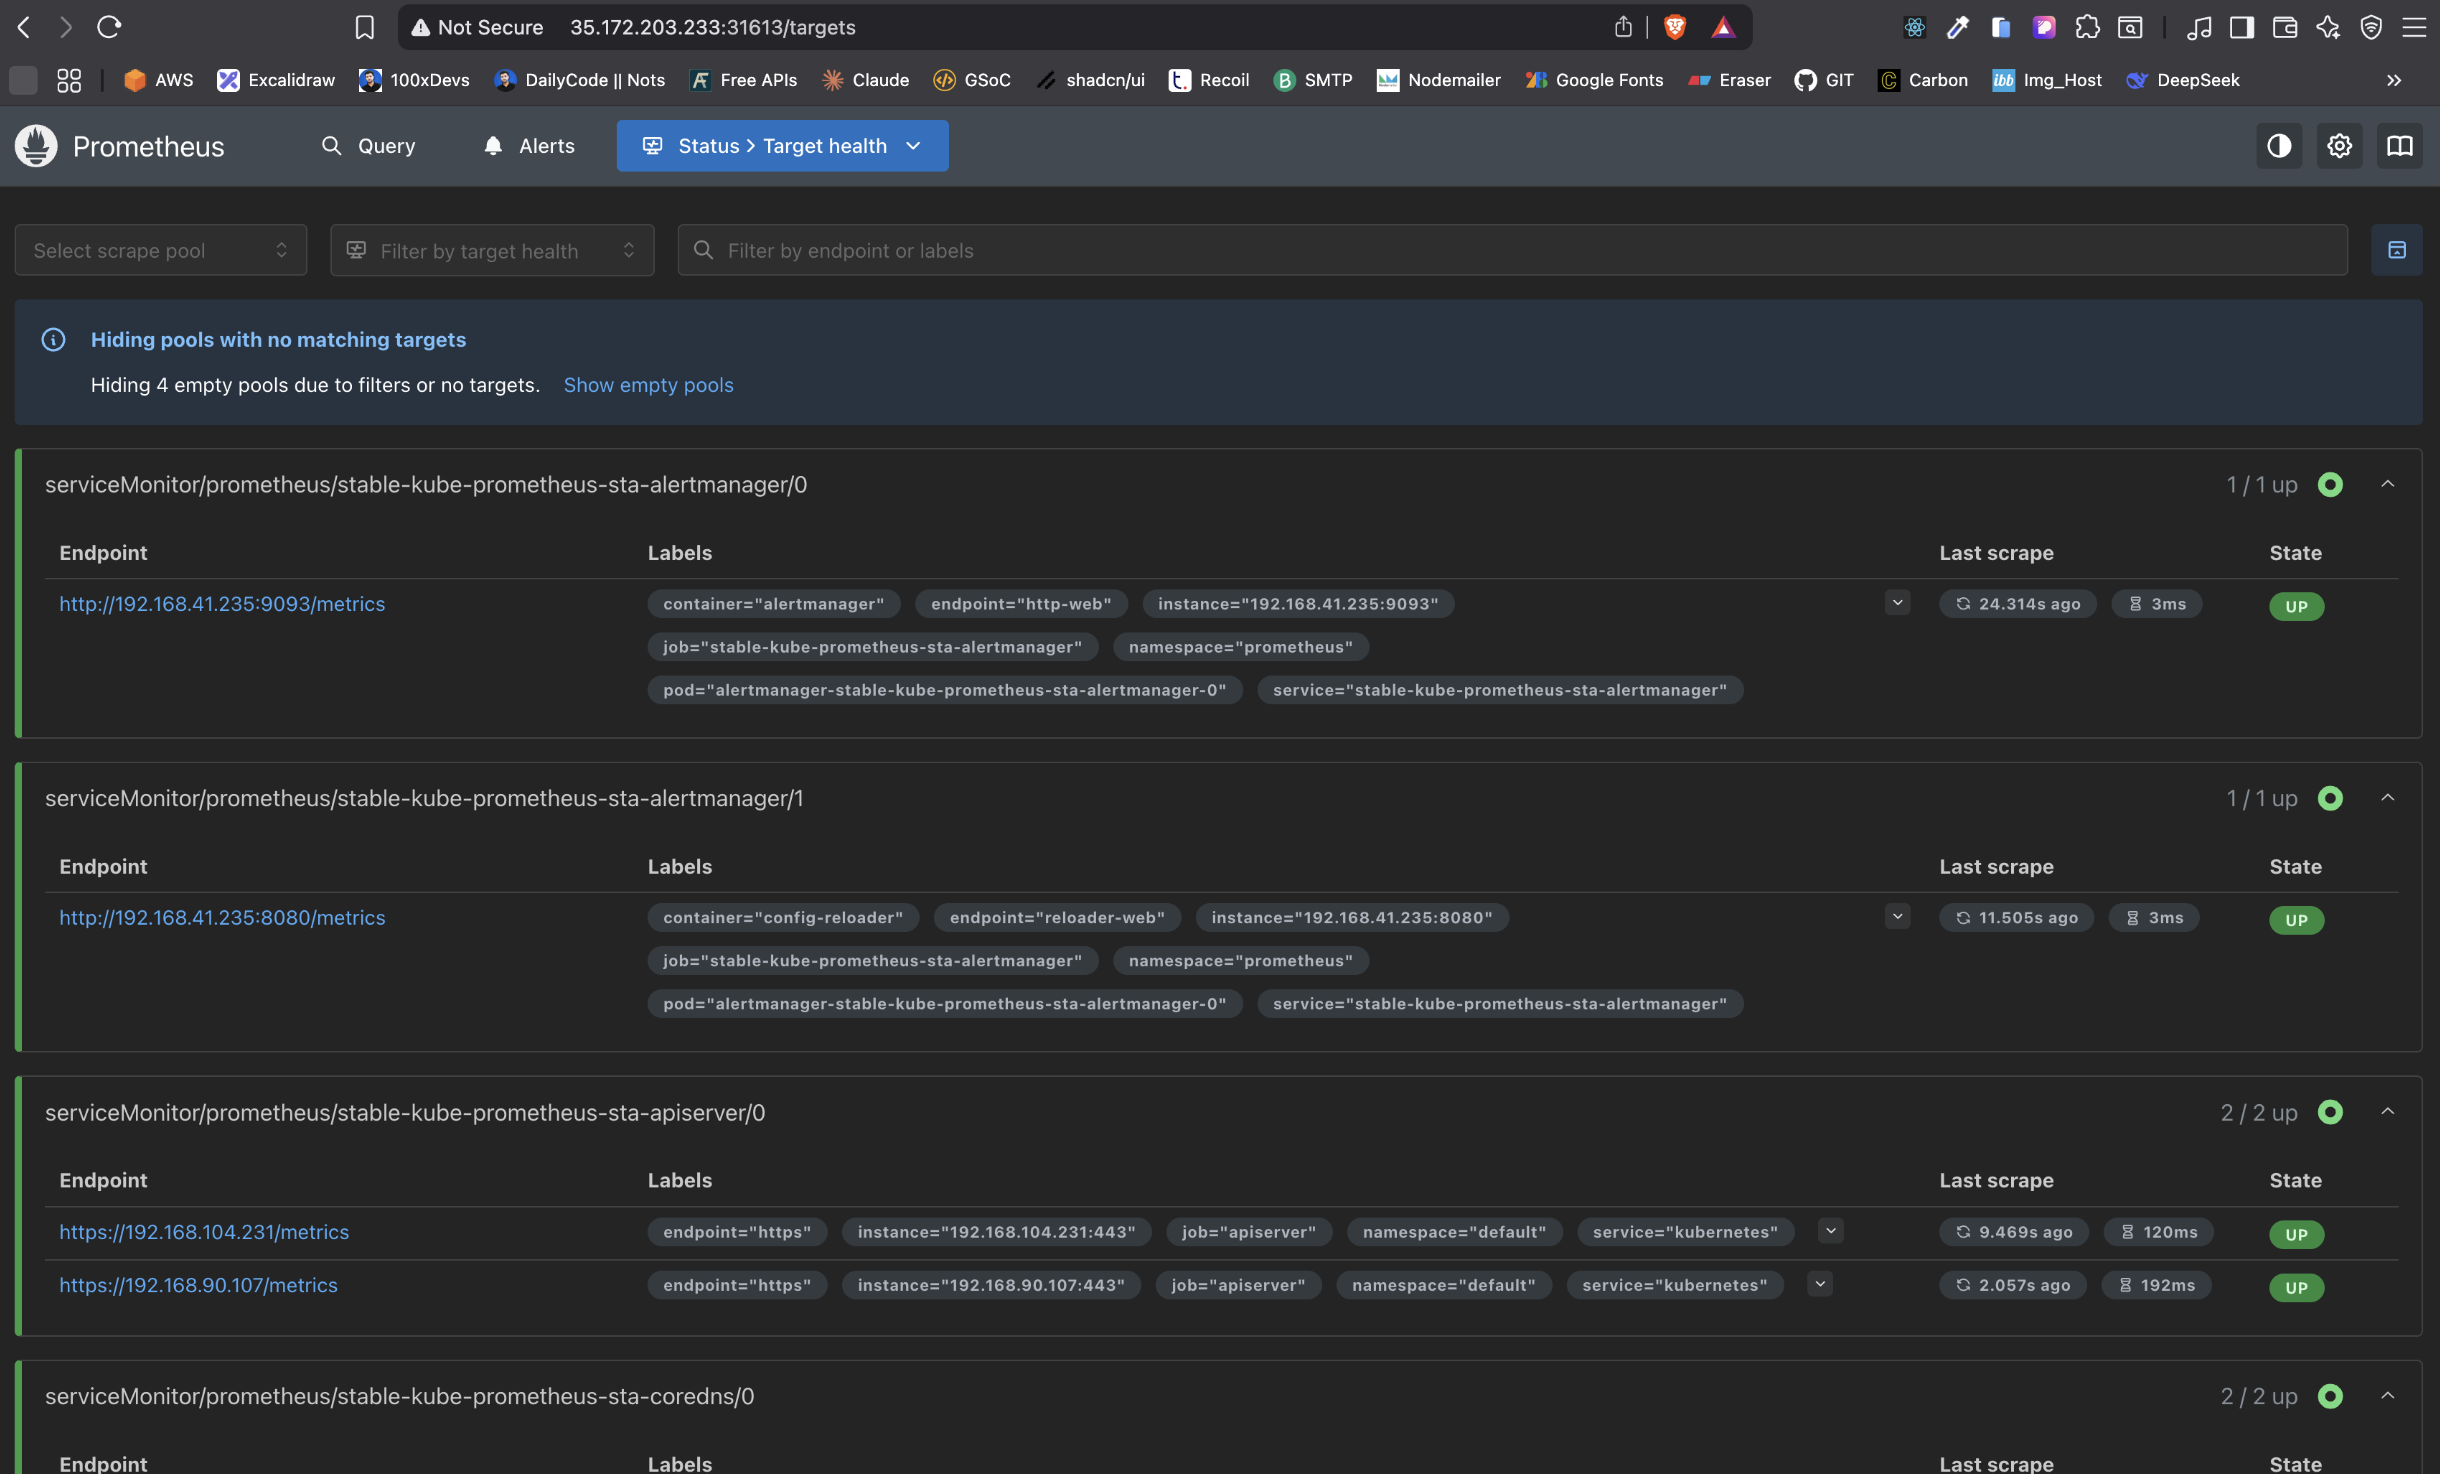
📷 Prometheus Metrics View:
To delete your cluster when done:
eksctl delete cluster --name=SyncPad --region=us-easy-1Contributions, issues, and feature requests are welcome!
If you’d like to contribute to this project:
- 🍴 Fork the repository
- 🔧 Create a new branch (
git checkout -b feature/your-feature-name) - ✍️ Make your changes
- ✅ Commit your changes (
git commit -m "feat: add your feature") - 🚀 Push to your branch (
git push origin feature/your-feature-name) - 🔃 Open a Pull Request
Please make sure your code follows the project's coding style and includes relevant documentation/comments if necessary.
Thank you for helping improve this project! 💙