PySS3: Interpretable Machine Learning for Text Classification (Try our Live Demo! 🍰)
PySS3 implements SS3, a simple supervised machine learning model for interpretable text classification. SS3 can self-explain its rationale, making it a reliable choice for tasks where understanding model decisions is critical.
It was originally introduced in Section 3 of "A text classification framework for simple and effective early depression detection over social media streams" (arXiv preprint) and obtained the best and second-best results, consecutively, in the three CLEF eRisk editions from 2019 to 2021 [Burdisso et al. 2019; Loyola et al. 2021].
PySS3 also includes variants of SS3, such as t-SS3, which dynamically recognizes variable-length word n-grams "on the fly" for early risk detection (paper, arXiv).
PySS3 is a Python library for working with SS3 in a visual, interactive, and straightforward way.
It provides tools to:
- Analyze, monitor, and understand what your model has learned.
- Visualize classification decisions and model insights.
- Evaluate and optimize hyperparameters efficiently.
The library is organized into three main components:
The core classifier with a clean API similar to sklearn:
from pyss3 import SS3

clf = SS3()
clf.fit(x_train, y_train)
y_pred = clf.predict(x_test)
Other useful methods include:
extract_insight()– Returns a list of text fragments involved in the classification decision, allowing you to understand the rationale behind the model’s predictions.classify_multilabel()– Multi-label classification support:
doc = "Liverpool CEO Peter Moore on Building a Global Fanbase"

label = clf.classify_label(doc)          # 'business'
labels = clf.classify_multilabel(doc)    # ['business', 'sports']
See all tutorials for step-by-step guidance.
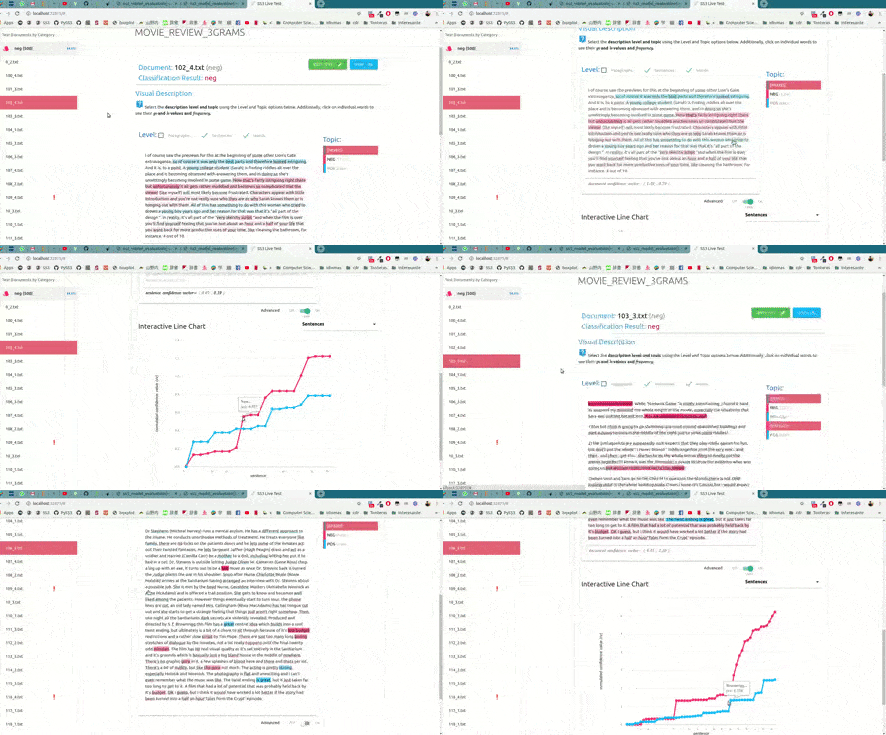
Interactively test models in your browser, with one line of code:
from pyss3.server import Live_Test

Live_Test.run(clf, x_test, y_test)
Try our online live demos:
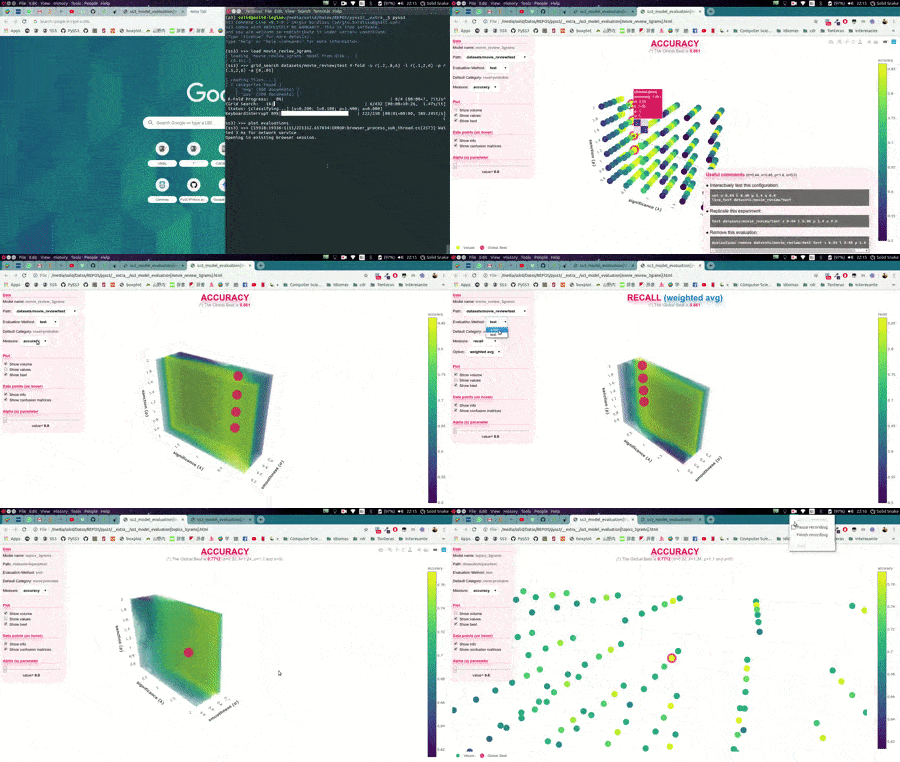
Evaluate and optimize your model easily:
from pyss3.util import Evaluation

best_s, best_l, best_p, _ = Evaluation.grid_search(
    clf, x_train, y_train,
    s=[0.2, 0.32, 0.44, 0.56, 0.68, 0.8],
    l=[0.1, 0.48, 0.86, 1.24, 1.62, 2],
    p=[0.5, 0.8, 1.1, 1.4, 1.7, 2],
    k_fold=4
)
Evaluation.plot()- Interactive 3D plots for hyperparameter evaluation
- Automatic history tracking of experiments
- Exportable HTML plots for sharing and reporting
Explore example evaluation plots:
pip install pyss3Full tutorial and documentation
Any contributions are welcome! Code, bug reports, documentation, examples, or ideas – everything helps.
Use the "Edit" button on GitHub to propose changes directly, and follow these guidelines for commit messages.
Thanks goes to these awesome people (emoji key):
Florian Angermeir 💻 🤔 🔣 |
Muneeb Vaiyani 🤔 🔣 |
Saurabh Bora 🤔 |
Hubert Baniecki 🤔 📖 |
This project follows the all-contributors specification. Contributions of any kind welcome!


